module_statistic
Overview
Profile data model structure breakdown (module_statistic) is an analysis feature provided by MindStudio Profiler Analyze (msprof-analyze) for automatic parsing of PyTorch model hierarchical structures. It helps accurately locate performance bottlenecks and provides key insights for model optimization. This analysis feature provides the following capabilities:
- Model structure breakdown: automatically extracts and displays the hierarchical structure of a model and the operator call sequence.
- Operator-to-kernel mapping: establishes the mapping between operators at the framework layer and the execution kernels on the NPU.
- Performance analysis: accurately collects statistics and outputs the execution duration of kernels on the device.
Preparations
Environment Setup
Install msprof-analyze. For details, see MindStudio Profiler Analyze Installation Guide.
Data preparation
-
Add model-level MSTX instrumentation.
Call the
torch_npu.npu.mstx.range_startandtorch_npu.npu.mstx.range_endperformance instrumentation APIs in the model code. Thenn.Modulecalling logic in PyTorch must be rewritten. -
Configure and collect profile data.
-
Use the
torch_npu.profilerAPI to collect profile data. - Set
mstx=Trueintorch_npu.profiler._ExperimentalConfigto enable instrumentation event collection (the corresponding parameter in earlier versions ismsprof_tx=True). - Modify the configuration to set
export_typeto includedbintorch_npu.profiler._ExperimentalConfig. - Flush profile data to the path specified by the
torch_npu.profiler.tensorboard_trace_handlerAPI. This directory serves as the input formsprof-analyze cluster.
For details about the complete sample code, see Sample Code for Profile Data Collection.
Model Structure Breakdown
Function
Analyzes the collected data (with model-level MSTX instrumentation) by using msprof-analyze.
Syntax
Command-line Options
| Option | Mandatory (Yes/No) | Description |
|---|---|---|
| -m | Yes | Specifies the analysis mode to execute. Set it to module_statistic to enable model structure breakdown. |
| -d | Yes | Specifies the cluster profile data directory. |
| -o | No | Specifies the output directory. |
| --export_type | No | Specifies the output file type. Valid values: db or text. |
For details about more options, see Command-line Options and Parameters of msprof-analyze.
Output Description
- The output results display the model hierarchy, operator call sequence, kernels executed on the NPU, and execution statistics.
-
If
export_typeis set totext, a separatemodule_statistic_{rank_id}.xlsxfile is generated for each device, as shown in the following figure.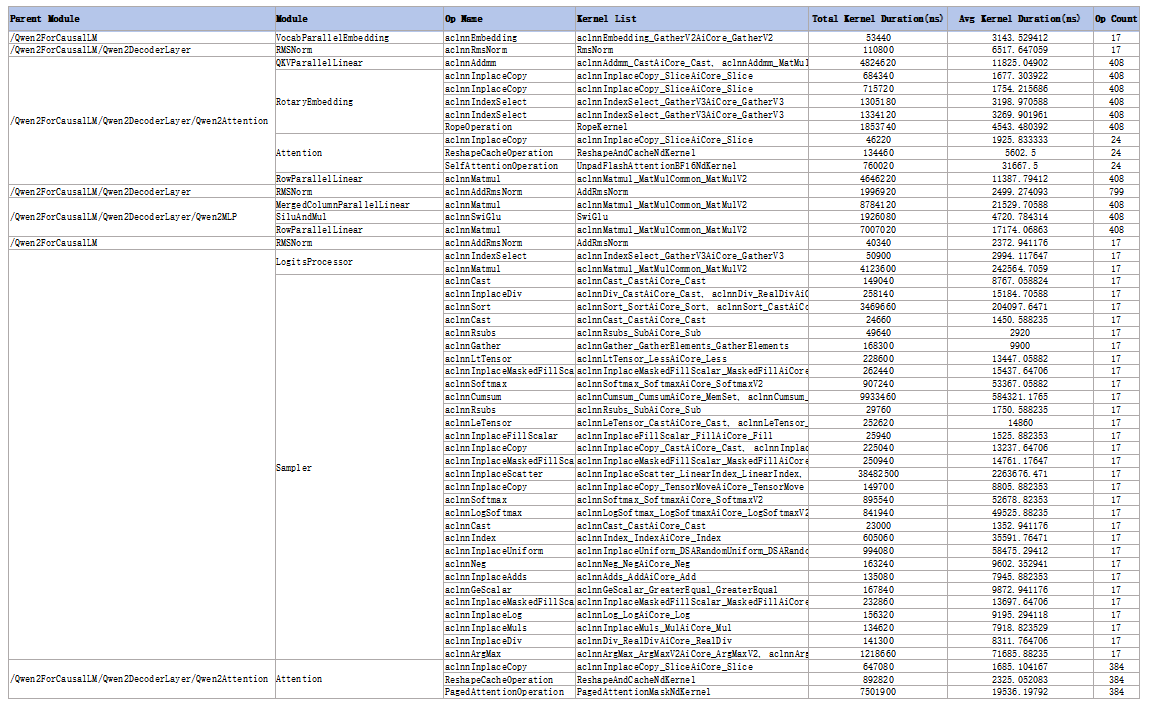
-
If
export_typeis set todb, results are saved to theModuleStatistictable incluster_analysis.db. The following table describes the fields.
| Field | Description |
|---|---|
| parentModule | Name (TEXT type) of the upper-layer module |
| module | Name (TEXT type) of the bottom-layer module |
| opName | Name (TEXT type) of the framework-side operator (within the same module, operators are sorted by call sequence) |
| kernelList | Sequence (TEXT type) of kernels delivered by the framework-side operator to the device for execution |
| totalKernelDuration(ns) | Total execution duration (REAL type) of kernels on the device corresponding to the framework-side operator (ns) |
| avgKernelDuration(ns) | Average execution duration (REAL type) of kernels on the device corresponding to the framework-side operator (ns) |
| opCount | Number (INTEGER type) of times the framework-side operator is executed during the collection period |
| rankID | Unique identifier (INTEGER type) for the device in cluster scenarios |
Appendixes
Sample Code for Profile Data Collection
For complex model structures, use a selective instrumentation strategy to reduce performance overhead. Core performance instrumentation is implemented as follows:
original_call = nn.Module.__call__

module_list = ["Attention", "QKVParallelLinear"]
def custom_call(self, *args, **kwargs):
    module_name = self.__class__.__name__
    if module_name not in module_list:
        return original_call(self, *args, **kwargs)
    mstx_id = torch_npu.npu.mstx.range_start(module_name, domain="Module")
    tmp = original_call(self, *args, **kwargs)
    torch_npu.npu.mstx.range_end(mstx_id, domain="Module")
    return tmp

nn.Module.__call__ = custom_call
The complete sample code is as follows:
import random
import torch
import torch_npu
import torch.nn as nn
import torch.optim as optim


original_call = nn.Module.__call__

def custom_call(self, *args, **kwargs):
    """Customize the `nn.Module` calling method and add MSTX instrumentation."""
    module_name = self.__class__.__name__
    mstx_id = torch_npu.npu.mstx.range_start(module_name, domain="Module")
    tmp = original_call(self, *args, **kwargs)
    torch_npu.npu.mstx.range_end(mstx_id, domain="Module")
    return tmp

# Replace the default call method
nn.Module.__call__ = custom_call

class RMSNorm(nn.Module):
    def __init__(self, dim: int, eps: float = 1e-6):
        super().__init__()
        self.eps = eps
        self.weight = nn.Parameter(torch.ones(dim))

    def _norm(self, x):
        return x * torch.rsqrt(x.pow(2).mean(-1, keepdim=True) + self.eps)

    def forward(self, x):
        output = self._norm(x.float()).type_as(x)
        return output * self.weight


class ToyModel(nn.Module):
    def __init__(self, D_in, H, D_out):
        super(ToyModel, self).__init__()
        self.input_linear = torch.nn.Linear(D_in, H)
        self.middle_linear = torch.nn.Linear(H, H)
        self.output_linear = torch.nn.Linear(H, D_out)
        self.rms_norm = RMSNorm(D_out)

    def forward(self, x):
        h_relu = self.input_linear(x).clamp(min=0)
        for i in range(3):
            h_relu = self.middle_linear(h_relu).clamp(min=random.random())
        y_pred = self.output_linear(h_relu)
        y_pred = self.rms_norm(y_pred)
        return y_pred


def train():
    N, D_in, H, D_out = 256, 1024, 4096, 64
    torch.npu.set_device(6)
    input_data = torch.randn(N, D_in).npu()
    labels = torch.randn(N, D_out).npu()
    model = ToyModel(D_in, H, D_out).npu()

    loss_fn = nn.MSELoss()
    optimizer = optim.SGD(model.parameters(), lr=0.001)

    experimental_config = torch_npu.profiler._ExperimentalConfig(
        aic_metrics=torch_npu.profiler.AiCMetrics.PipeUtilization,
        profiler_level=torch_npu.profiler.ProfilerLevel.Level2,
        l2_cache=False,
        mstx=True,  # Enable MSTX collection. The original parameter name is msprof_tx.
        data_simplification=False,
        export_type=[
            torch_npu.profiler.ExportType.Text,
            torch_npu.profiler.ExportType.Db
        ],  # The export_type parameter must include db.
    )

    prof = torch_npu.profiler.profile(
        activities=[torch_npu.profiler.ProfilerActivity.CPU, torch_npu.profiler.ProfilerActivity.NPU],
        schedule=torch_npu.profiler.schedule(wait=1, warmup=1, active=3, repeat=1, skip_first=5),
        on_trace_ready=torch_npu.profiler.tensorboard_trace_handler("./result"),
        record_shapes=True,
        profile_memory=False,
        with_stack=False,
        with_modules=True,
        experimental_config=experimental_config)
    prof.start()

    for i in range(12):
        optimizer.zero_grad()
        outputs = model(input_data)
        loss = loss_fn(outputs, labels)
        loss.backward()
        optimizer.step()
        prof.step()

    prof.stop()


if __name__ == "__main__":
    train()