Typical Cases
Optimizing Operators Using Instruction Pipeline Chart
Overview
This section demonstrates how to use the instruction pipeline charts of the msOpProf tool to analyze operator bottlenecks and optimize operator performance.
Procedure
- Refer to the msOpProf Simulator User Guide to import the
visualize_data.binfile obtained from operator simulation profile data into MindStudio Insight. For details about the import operation, see the Importing Profile Data chapter in the MindStudio Insight User Guide. -
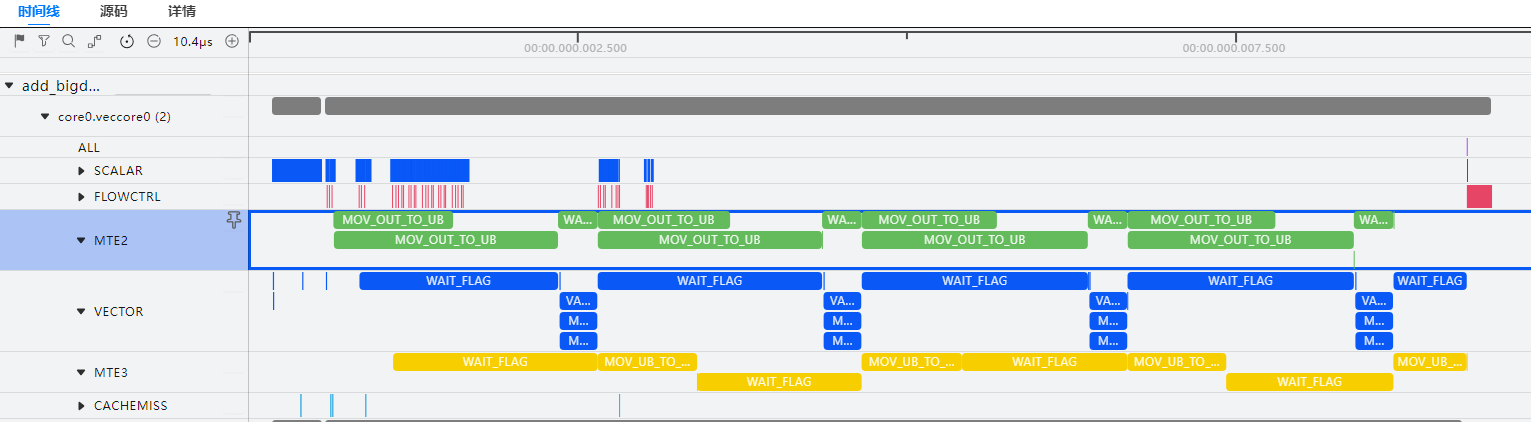
Take a Vector operator snippet as an example and view the operator instruction pipeline chart.
It can be found that the MTE2 pipeline does not execute the transfer instruction during VADD computation, making it the performance bottleneck of the operator. To optimize operator performance, the transfer efficiency of the MTE2 pipeline needs to be improved.
-
There are multiple ways to improve MTE2 transfer efficiency. This example uses the double buffer mechanism of Ascend C operators.
In the operator kernel function, you can enable double buffering by changing the second parameter (
BUFFER_NUM) ofInitBufferinTPipefrom 1 to 2. For details aboutInitBuffer, see Base API > Memory Management and Synchronization Control > TPipe > InitBuffer in the Ascend C Operator Development API. -
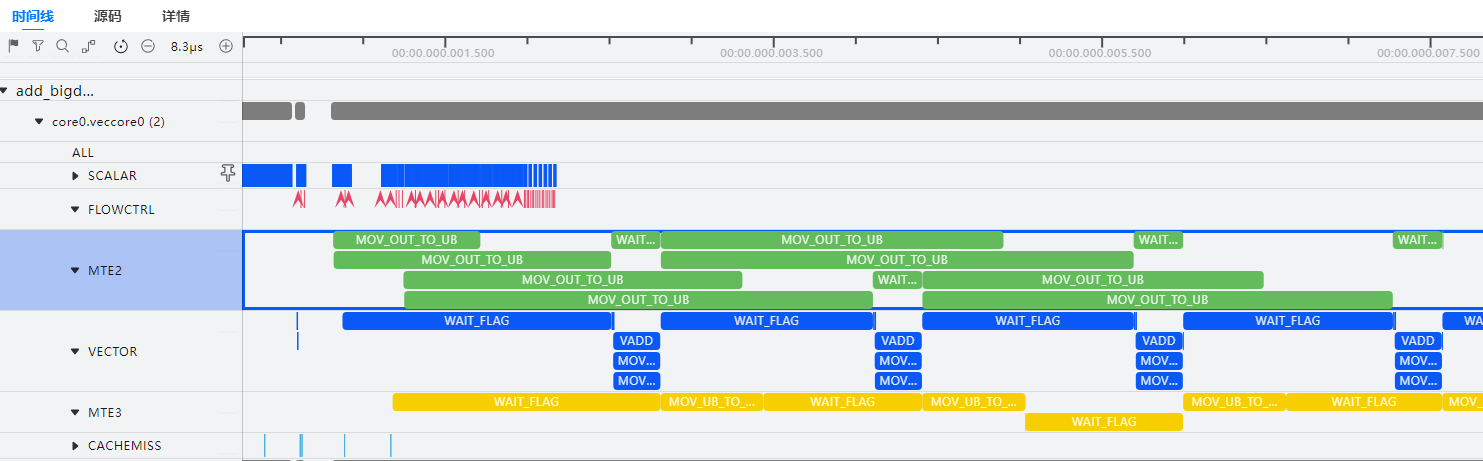
Perform 1 again and view the optimized instruction pipeline chart.
During VADD instruction computation, the transfer instruction on MTE2 is also executed synchronously, achieving more efficient data transfer.
Performing Range-Level Replay with mstx APIs
Overview
This section demonstrates how to use the msOpProf tool and the mstx APIs to implement range-level replay to retain the L2 cache information in the context during operator execution.
Preparations
Prepare the operator project and add mstx extended APIs to the operator code to define the range for range-level replay. For details, see mstx Extended Functions and the MindStudio mstx API Reference.
[!NOTE]
- The
mstxRangeStartAandmstxRangeEndAPIs must be called in pairs and cannot be nested across. The operators contained in each pair of mstx APIs form a replay range. The streams of the operators in the replay range cannot be changed.- The number of operators that can be collected in each replay range is limited by the number of operator block dims in OpBasicInfo (Basic Operator Information). It is recommended that the number be less than or equal to 50.
- This function cannot be enabled together with
--aic-metrics=MemoryDetail,--aic-metrics=TimelineDetail, or--aic-metrics=Source. You are advised not to enable this function together with--kill=onbecause it may result in missing operator data.- During range-level replay, the
SynchronizeStreamoperator may fail to be executed. You are advised to execute the operator after themstxRangeEndAPI call ends.- This function applies only to Atlas A3 training products/Atlas A3 inference products, Atlas A2 training products/Atlas A2 inference products, and Atlas 350 accelerator cards.
Precautions
When collecting basic information about shmem operators, select the range mode. Note the following:
- For shmem operators with older versions of drivers, using the tool may cause operator precision deviations, but this does not affect the accuracy of profile data. You can still use the tool to view profile data.
- You are advised to manually add synchronization statements before calling operators that require synchronization. Otherwise, unsynchronized execution may occur. In severe cases, the operators may hang.
Example
The Python API (test.py file) is used as an example to describe how the msOpProf tool works with mstx APIs to implement range-level replay.
import mstx
import torch
import torch_npu

x = torch.Tensor([1,2,3,4]).npu()
y = torch.Tensor([1,2,3,4]).npu()

a = x + y
range1_id = mstx.range_start("range1", None)
b = a - x
c = a * x
mstx.range_end(range1_id)
range2_id = mstx.range_start("range2", None)
d = x / y
range3_id = mstx.range_start("range3", None)
e = torch.abs(y)
mstx.range_end(range3_id)
f = x + e
mstx.range_end(range2_id)
Procedure
-
Single-range replay
-
Run the following command to enable a single mstx API range. The following command performs range-level replay for "range1."
-
The tool generates the tuning data of the
SubandMuloperators, and the L2 cache information between the two operators is retained. For details about the profile files, see Table 2 msOpProf mode files.
-
-
Multi-range replay
-
Run the following command to enable all mstx APIs:
-
The tool executes range-level replay for "range1" and "range2" sequentially, generating tuning data for
Sub,Mul,Div,Abs, andAddoperators. The L2 cache information during each replay is retained, but the L2 cache information during two replays is independent of each other. However, because "range2" and "range3" overlap, only the first range takes effect, and "range3" is invalid. For details about the profile files, see Table 2 msOpProf mode files.OPPROF_{timestamp}_XXX ├── Abs_XXX // Abs_XXX is the name of the collected operator. │ └── 0 │ ├── dump ... │ └── visualize_data.bin ├── Add_XXX │ └── 0 │ ├── dump ... │ └── visualize_data.bin ├── Mul_XXX │ └── 0 │ ├── dump ... │ └── visualize_data.bin ├── RealDiv_XXX │ └── 0 │ ├── dump ... │ └── visualize_data.bin └── Sub_XXX └── 0 ├── dump ... └── visualize_data.bin
-