msOpProf Mode User Guide
Overview
MindStudio Ops Profiler (msOpProf, an operator tuning tool) is used to collect and analyze the key performance metrics of operators running on AI Processors. Based on the output profile data, you can quickly locate the hardware and software performance bottlenecks of operators, improving the efficiency of operator performance analysis.
Currently, profile data for different file formats (executable files or operator binary .o files) can be collected and automatically parsed in on-board (msOpProf) and simulator (msOpProf simulator) modes.
This document describes how to use the msOpProf mode.
Features
msOpProf demonstrates single-operator tuning capabilities such as the computing memory heatmap, Roofline bottleneck analysis chart, cache heatmap, communication and computing pipeline chart (for MC2 operators), pipeline chart, operator code hot spot map, and profile data files through MindStudio Insight. For details, see Table 1 msOpProf mode features.
Table 1 msOpProf mode features
| Function | Link |
|---|---|
| Computing memory heatmap | Computing Memory Heatmap |
| Roofline Bottleneck Analysis Chart | Roofline Bottleneck Analysis Chart |
| Cache Heatmap | Cache Heatmap |
| Communication and Computing Pipeline Chart | Communication and Computing Pipeline Chart |
| Pipeline Chart | Pipeline Chart |
| Operator Code Hot Spot Map | Operator Code Hot Spot Map |
| Profile data files | msopprof Profile Data |
Scenarios
| Invocation Scenario | Reference Section |
|---|---|
| Kernel Direct Invocation Scenario | Kernel Direct Invocation |
| Single Operator API Invocation Scenario | Single Operator API Invocation |
| PyTorch Framework Operator Integration | PyTorch Framework Operator Invocation |
| Triton-Ascend Operator | Triton Operator Invocation |
| catlass Operator | catlass Operator Invocation |
| MC2 Operator Invocation Scenario | MC2 Operator Invocation |
Preparations
Environment Preparation
-
Configure related environment variables by referring to the MindStudio Ops Profiler Installation Guide (see../install_guide/msopprof_install_guide.md).
-
To use MindStudio Insight for viewing, install the MindStudio Insight software package separately. For download links, see the MindStudio Insight Installation Guide.
Constraints
- You are advised to collect profile data within 5 minutes and ensure that the set memory size is greater than 20 GB (for example, container configuration
docker run --memory=20g container_name). - Ensure that the profile data is stored in the current user directory that does not contain soft links. Otherwise, security issues may occur.
Precautions
- msOpProf depends on the msOpProf executable file in the CANN package. The API usage in this file is the same as that in msOpProf. This file is provided by the CANN package and does not need to be installed separately.
- After you press
CTRL+C, the operator execution stops, and the tool generates a profile data file based on existing information. If you do not need to generate the file, pressCtrl+Cagain. - If the
--outputoption is not specified, ensure that other users do not have the write permission on the upper-level directory of the current path. - Before using msOpProf, ensure that the application functions properly.
- Do not initiate more than one profile data collection task on the same device.
- You need to ensure the execution security of executable files or applications.
- You are advised to restrict the operation permission on executable files or applications to avoid privilege escalation risks.
- Avoid high-risk operations (such as deleting files, deleting directories, changing passwords, and running privilege escalation commands) to prevent security risks.
Command Reference
Log in to the operating environment and run the msprof op optional parameter app [arguments] command. For details about the optional parameters, see Table 1 Optional parameters of msOpProf (#Optional parameters of msOpProf). An example command is as follows:
msprof op --output=$HOME/projects/output $HOME/projects/MyApp/out/main blockdim 1 # "--output" is an optional parameter, "$HOME/projects/MyApp/out/main" is the application, and "blockdim 1" is an optional parameter of the application.
Table 1 msOpProf Optional Parameters
| Option | Description | Mandatory or Not (Y/N) |
|---|---|---|
| --application | You are advised to use msprof op [msOpProf parameters] ./app for launching, where app is the specified executable file. If no path is specified for app, the current path is used by default.When using ./app, add msOpProf parameters before./app to ensure that the related functions take effect.Currently, this command is compatible with ./app [arguments]. In the future, it will be changed to ./app [arguments]. |
Yes. Select either the specified executable file or --config. |
| --config | Specifies the absolute or relative path of the binary file *.o generated after operator compilation. For details, see JSON Configuration File Description.Before operator tuning, you can obtain the operator binary *.o file in either of the following ways:
--config and its parent directory. In addition, ensure that the owner of the parent directory of the JSON file is the current user. |
Yes. Choose one of the specified executable file or --config. |
| --kernel-name | This option specifies the name of the operator whose data is to be collected. Fuzzy match using the operator name prefix is supported. If this parameter is not specified, only data of the first operator scheduled during program running is collected. Note: --application. The value can contain a maximum of 1,024 characters, restricted to letters, digits, and underscores (_). --launch-count. *) can be used match strings of any length. |
No |
| --launch-count | Sets the maximum number of operators that can be collected. The default value is 1, and the value is an integer ranging from 1 to 5000. | No |
| --launch-skip-before-match | Sets the number of operators for which data does not need to be collected. Collection starts only after the specified number of operators, starting from the first operator. Note:
|
No |
| --aic-metrics | Enables collection of operator performance metrics.
|
No |
| --kill | The value can be on or off. The default value is off, indicating that the function is disabled.If --kill=on is set to enable this function, the user program will automatically stop after the number of operators set by --launch-count is collected.Note: After --kill=on is configured, error logs may occur due to the early termination of the user program. You need to evaluate whether to use this function. --kill parameter configuration takes effect only for subprocesses. --replay-mode=range. Otherwise, the collected operator data may be missing. |
No |
| --mstx | Determines whether the operator tuning tool enables the mstx APIs used in the user code program. The default value is off, indicating that the mstx APIs are disabled.When --mstx=on is set, the operator tuning tool enables the mstx API used in the user program. The following is an example: msprof op --mstx=on ./add_customNote:
|
No |
| --mstx-include | Enables the specified mstx APIs when mstx APIs are enabled in the operator tuning tool. If this parameter is not set, all mstx APIs used in user code are enabled by default. If this parameter is set, only the specified mstx APIs are enabled. The input of --mstx-include is the message string transferred when the user calls the mstx function. Multiple strings are concatenated using "|" For example, --mstx=on --mstx-include="hello\|hi" // Only the mstx APIs whose message parameters in the mstx function are hello and hi are enabled.Note:
|
No |
| --replay-mode | Replay mode for operator data collection. Options include kernel, application, and range. The default value is kernel. If set to application, the entire application is replayed multiple times.In application mode, separately enabling some aic-metrics may lead to missing data in the visualize_data.bin file. To view complete visualize_data.bin data, you are advised to add Default to --aic-metrics. kernel, the kernel function of a single operator within the specified collection range is replayed multiple times. range, multiple operators within the specified range are replayed multiple times as a whole. Multiple ranges can be specified, and ranges are independent of each other. application mode is not supported in multi-device multi-operator scenarios. --mstx=on and is applicable only to the Atlas A3 training products, Atlas A3 inference products, Atlas A2 training products, and Atlas A2 inference products. --kill=on, --aic-metrics=MemoryDetail, --aic-metrics=TimelineDetail, and --aic-metrics=Source. |
No |
| --warm-up | When some operators are collected using msOpProf, they may fail to reach the minimum task time consumption for processor frequency increasing, resulting in frequency reduction, which affects the results. In this case, you can use --warm-up to specify the number of warm-up times to increase the running frequency of the AI Processor in advance, so that the data on the board is more accurate.Note:
|
No |
| --output | Path for storing the collected profile data. By default, the profile data is stored in the current directory. Ensure that users in the group and other groups do not have the write permission on the parent directory of the path specified by --output. In addition, ensure that the owner of the parent directory of the directory specified by --output is the current user. |
No |
| --dump | Specifies whether to generate the dump file of the simulator. The value can be on or off. The default value is off, indicating that the simulator dump file is not generated.Note:
|
No |
| --core-id | This parameter is used when the operators are evenly distributed. You can use --core-id to specify the IDs of some logical cores to parse their simulation data.The core ID range is [0, 49]. Note:
|
No |
| -h, --help | Outputs help information. | No |
Tool Usage
msOpProf assists in identifying exceptions in the operator memory, code, and instructions, enabling comprehensive operator tuning. For details, see Table 1 msOpProf functions.
| Application Scenario | Usage | Displayed Graphs |
|---|---|---|
| It is suitable for performance analysis in the actual operating environment and allows users to locate operator memory and performance bottlenecks. | It analyzes running operators without additional configuration, which is suitable for quickly locating operator performance issues in the board environment. | Computing Memory Heatmap Roofline Bottleneck Analysis Chart Cache Heatmap Communication and Computing Pipeline Chart Pipeline Chart Operator Code Hot Spot Map |
msOpProf segment-based tuning principles
-
Use the
--launch-skip-before-matchcommand to filter the operator tuning range. The filtering principles are as follows:- If
--launch-skip-before-matchis configured, collection starts only after the specified number of operators, starting from the first operator. - If no range is configured, no filtering is performed.
- If
-
Based on 1, use the
--mstxcommand to filter the operator tuning range. The filtering principles are as follows:- If
--mstxis configured, only operators within the range enabled by themstxRangeStartAandmstxRangeEndinterfaces are collected. - If no range is configured, no filtering is performed.
- If
-
Based on 2, use the
--kernel-namecommand to filter the operator tuning range. The filtering principles are as follows:- If
--kernel-nameis configured, only operators within the--kernel-namerange are collected. - If
--kernel-nameis not configured, only the first operator scheduled during program execution is collected.
- If
-
Based on 3, use the
--aic-metricscommand to filter the operator tuning data collection items. The filtering principles are as follows:- If
--aic-metricsis configured, select the collection items for operator performance metrics. - If
--aic-metricsis not configured, operator performance metrics in the Default section are collected by default. Performance metrics in the KernelScale, TimelineDetail, Roofline, and Occupancy sections cannot be collected.
- If
-
Through layer-by-layer filtering from 1 to 4, you can obtain the actual number of tuned operators and the collection range of performance metrics.
- With
--kill=on, compare the actual number of tuned operators with the value of--launch-countto determine whether to automatically stop the program.
If the number of tuned operators is less than or equal to the value of--launch-count, go to the next step. Otherwise, the program automatically stops when the number of tuned operators reaches the value specified by--launch-count.
msOpProf configuration
To implement the cache heatmap jump function, perform the following operations:
- Add the
-gcompilation option when compiling operators. For details, see Adding the-gto compilation option. - Enable the
Sourceoption for the--aic-metricsparameter.
Starting the tool
[!NOTE]NOTE
Currently, msOpProf does not support the-O0compilation option.
-
Log in to the operating environment and run the
msprof op optional parameter app [arguments]command to enable operator tuning on the board. For details about the optional parameters, see Command Reference. An example command is as follows: -
Perform operator tuning in either of the following ways:
-
Based on an executable file
-
Single-operator scenario (using
testas an example) > [!NOTE]NOTE
> The executable file nametestin the example is for reference only. The actual name is subject to the executable file generated during compilation in the current project.Example 1:
Example 2:
-
Multi-operator scenario
If the
testexecutable containsAdd,MatMul, andSuboperators, you can use--launch-countand--kernel-nameto specify collecting data for theAddandSuboperators only.
-
-
Based on the .json configuration file the input operator binary file *.o. For details, see JSON Configuration File Description.
-
-
After the command is executed, a folder named
OPPROF_{timestamp}_XXXis generated in the default path or the specified--outputdirectory. When all--aic-metricsare enabled, the structure is as follows:-
Collecting data in the multi-device multi-operator scenario
[!NOTE]NOTE
When tuning MC2 or LCCL operators in multi-device parallel mode, several subdirectories named after device IDs will exist in the result directory, depending on the specified number of NPUs. The tuning results of each NPU are stored in the corresponding device ID directory.└──OPPROF_{timestamp}_XXX ├── device0 // ID of the AI processor used during running. └── device1 ├── OpName0 // Name of the operator collected. │ ├── 0 // Sequence in which operators are scheduled. │ │ ├──dump // Folder for storing the process files. The meaning of this parameter is the same as that in single-operator collection. │ │ └──xxx_yyy.csv // xxx is the metric type name, for example, L2Cache. For metric types, see Table 2. yyy is the time sequence suffix, for example, L2Cache_20240603022812284.csv │ │ └──visualize_data.bin ├── OpName1 │ ├── 0 │ │ ├──dump │ │ └──xxx_yyy.csv │ │ └──visualize_data.bin ├── OpName2 │ ├── 0 │ │ ├── dump │ │ └── xxx_yyy.csv │ │ └──visualize_data.bin │ │ └── trace.json // Applicable only to MC2 and LCCL operators. -
Collecting data in the single-device multi-operator scenario
└──OPPROF_{timestamp}_XXX ├── OpName0 // Name of the operator collected. │ ├── 0 // Sequence in which operators are scheduled. │ │ ├── dump // Folder for storing the process files. The meaning of this parameter is the same as that in single-operator collection. │ │ └── xxx_yyy.csv // xxx is the metric type name, for example, L2Cache. For metric types, see Table 2. yyy is the time sequence suffix, for example, L2Cache_20240603022812284.csv │ │ └──visualize_data.bin │ ├── 1 │ │ ├──dump │ │ └──xxx_yyy.csv │ │ └──visualize_data.bin ├── OpName1 │ ├── 0 │ │ ├── dump │ │ └── xxx_yyy.csv │ │ └── visualize_data.bin -
Collecting data in the single-device single-operator scenario
Table 2 msOpProf mode files
Name Description dump Raw profile data, which does not require attention. ArithmeticUtilization.csv Execution time and ratios of cube and vector instructions. See ArithmeticUtilization (Execution Time and Ratios of Cube and Vector Instructions). L2Cache.csv L2 Cache hit rate. See L2Cache (L2 Cache Hit Rate). Memory.csv UB/L1/L2/main memory read/write bandwidth rate. See Memory (Memory Read/Write Bandwidth Rate). MemoryL0.csv L0A/L0B/L0C read/write bandwidth rate. See MemoryL0 (L0 Read/Write Bandwidth Rate). MemoryUB.csv MTE/vector/scalar UB read/write bandwidth rate. See MemoryUB (UB Read/Write Bandwidth Rate). PipeUtilization.csv Execution time and ratios of compute units and MTEs. See PipeUtilization (Execution Time and Ratios of Compute Units and MTEs). ResourceConflictRatio.csv Ratio of bank group conflict, bank conflict, and resource conflict on UB in all instructions. See ResourceConflictRatio (Resource Conflict Ratio). OpBasicInfo.csv Basic operator information, including operator name, block dim, and time consumption. See OpBasicInfo (Basic Operator Information). visualize_data.bin Visualized file that displays basic operator information, computing unit load, hot spot functions, and Roofline bottleneck analysis. trace.json Visualized MC2 pipeline file. [!NOTE]NOTE
- visualize_data.bin can be visualized using MindStudio Insight. For details, see MindStudio Insight Operator Tuning.
- The hot spot function function of msOpProf is supported only by
Atlas A2 training products and Atlas A2 inference products . - Currently, communication and computing pipeline chart can be generated only for MC2 and LCCL operators.
- Cache heatmaps or operator code hot spot maps cannot be generated for MC2 or LCCL operators or for
Atlas inference products - The unit is GB/s, indicating that 1 GB data is transmitted per second.
-
-
After the
visualize_data.binfile is imported into MindStudio Insight, Computing memory heatmap, Roofline bottleneck analysis chart, Cache heatmap, communication and computing pipeline chart, and Operator code hot spot map are displayed. - After the
trace.jsonfile is imported into the Chrome browser or MindStudio Insight, the communication and computing pipeline chart is displayed.
Computing Memory Heatmap
Function Description
Visualizes the visualize_data.bin file generated in msOpProf. The page presents basic operator information, computing workload analysis data, and memory workload analysis data by resource, allowing developers to identify resource bottlenecks from a comprehensive perspective.
For details about MindStudio Insight operations, see the Details section in MindStudio Insight Operator Tuning.
Usage Description
The following shows the MindStudio Insight page of the visualize_data.bin file.
Figure 1 Details page 1

-
Core Occupancy displays the time consumption, total data throughput, and cache hit ratio of each physical core in a data pane, allowing developers to improve the usage efficiency of physical cores.
[!NOTE]NOTE
- Only
Atlas A3 training products, Atlas A3 inference products ,Atlas A2 training products, Atlas A2 inference products , andAscend 950 products support this function. - The number of cores displayed depends on the hardware.
- Only
-
Roofline bottleneck analysis chart. For details, see Roofline Bottleneck Analysis Chart.
- Compute Workload Analysis displays computing workload data in bar charts and data tables, helping developers analyze whether Cube/Vector computing resources are fully utilized.
-
Memory workload analysis displays the active bandwidth of each MTE channel. (If MemoryDetail is not enabled, the active bandwidth of MTE1 and MTE2 channels on the Cube is not displayed.) The memory heatmap and data pane display the number of requests, transfer bandwidth, and usage of each channel. This helps developers analyze channels that may have bottlenecks.
[!NOTE]NOTE
- The content displayed in data panes varies depending on the operator type.
- The active bandwidth value function does not apply to
Atlas inference products . Atlas A3 training products or Atlas A3 inference products does not support peak value (maximum bandwidth ratio) display.- For
Ascend 950 products , data display for UB read/write VEC units is currently not supported for operators containing the SIMD architecture.
Roofline Bottleneck Analysis Chart
Function Description
Visualizes the visualize_data.bin file generated in msOpProf. The roofline bottleneck analysis chart can be used to build a processor performance model. A Roofline bottleneck analysis chart can be used to build a processor performance model, which can be used to quickly evaluate the theoretical performance limit of an operator, allowing developers to quickly identify bottlenecks.
For details about MindStudio Insight operations, see the Details section in MindStudio Insight Operator Tuning.
Usage Description
Page introduction
The generated visualize_data.bin file can be visualized using MindStudio Insight. Different Roofline analysis charts are generated for different hardware and operator types.
-
The Roofline bottleneck analysis chart of
Atlas inference products contains only the memory unit view.Figure 1 Roofline bottleneck analysis chart of
Atlas inference products 
-
For
Atlas A3 training products, Atlas A3 inference products ,Atlas A2 training products, and Atlas A2 inference products , different views are generated based on the operator type. For details, see Table 1 Roofline chart support for Atlas A3 training products, Atlas A3 inference products, Atlas A2 training products, and Atlas A2 inference products.Figure 2 Roofline bottleneck analysis chart for
Atlas A3 training products, Atlas A3 inference products ,Atlas A2 training products, and Atlas A2 inference products 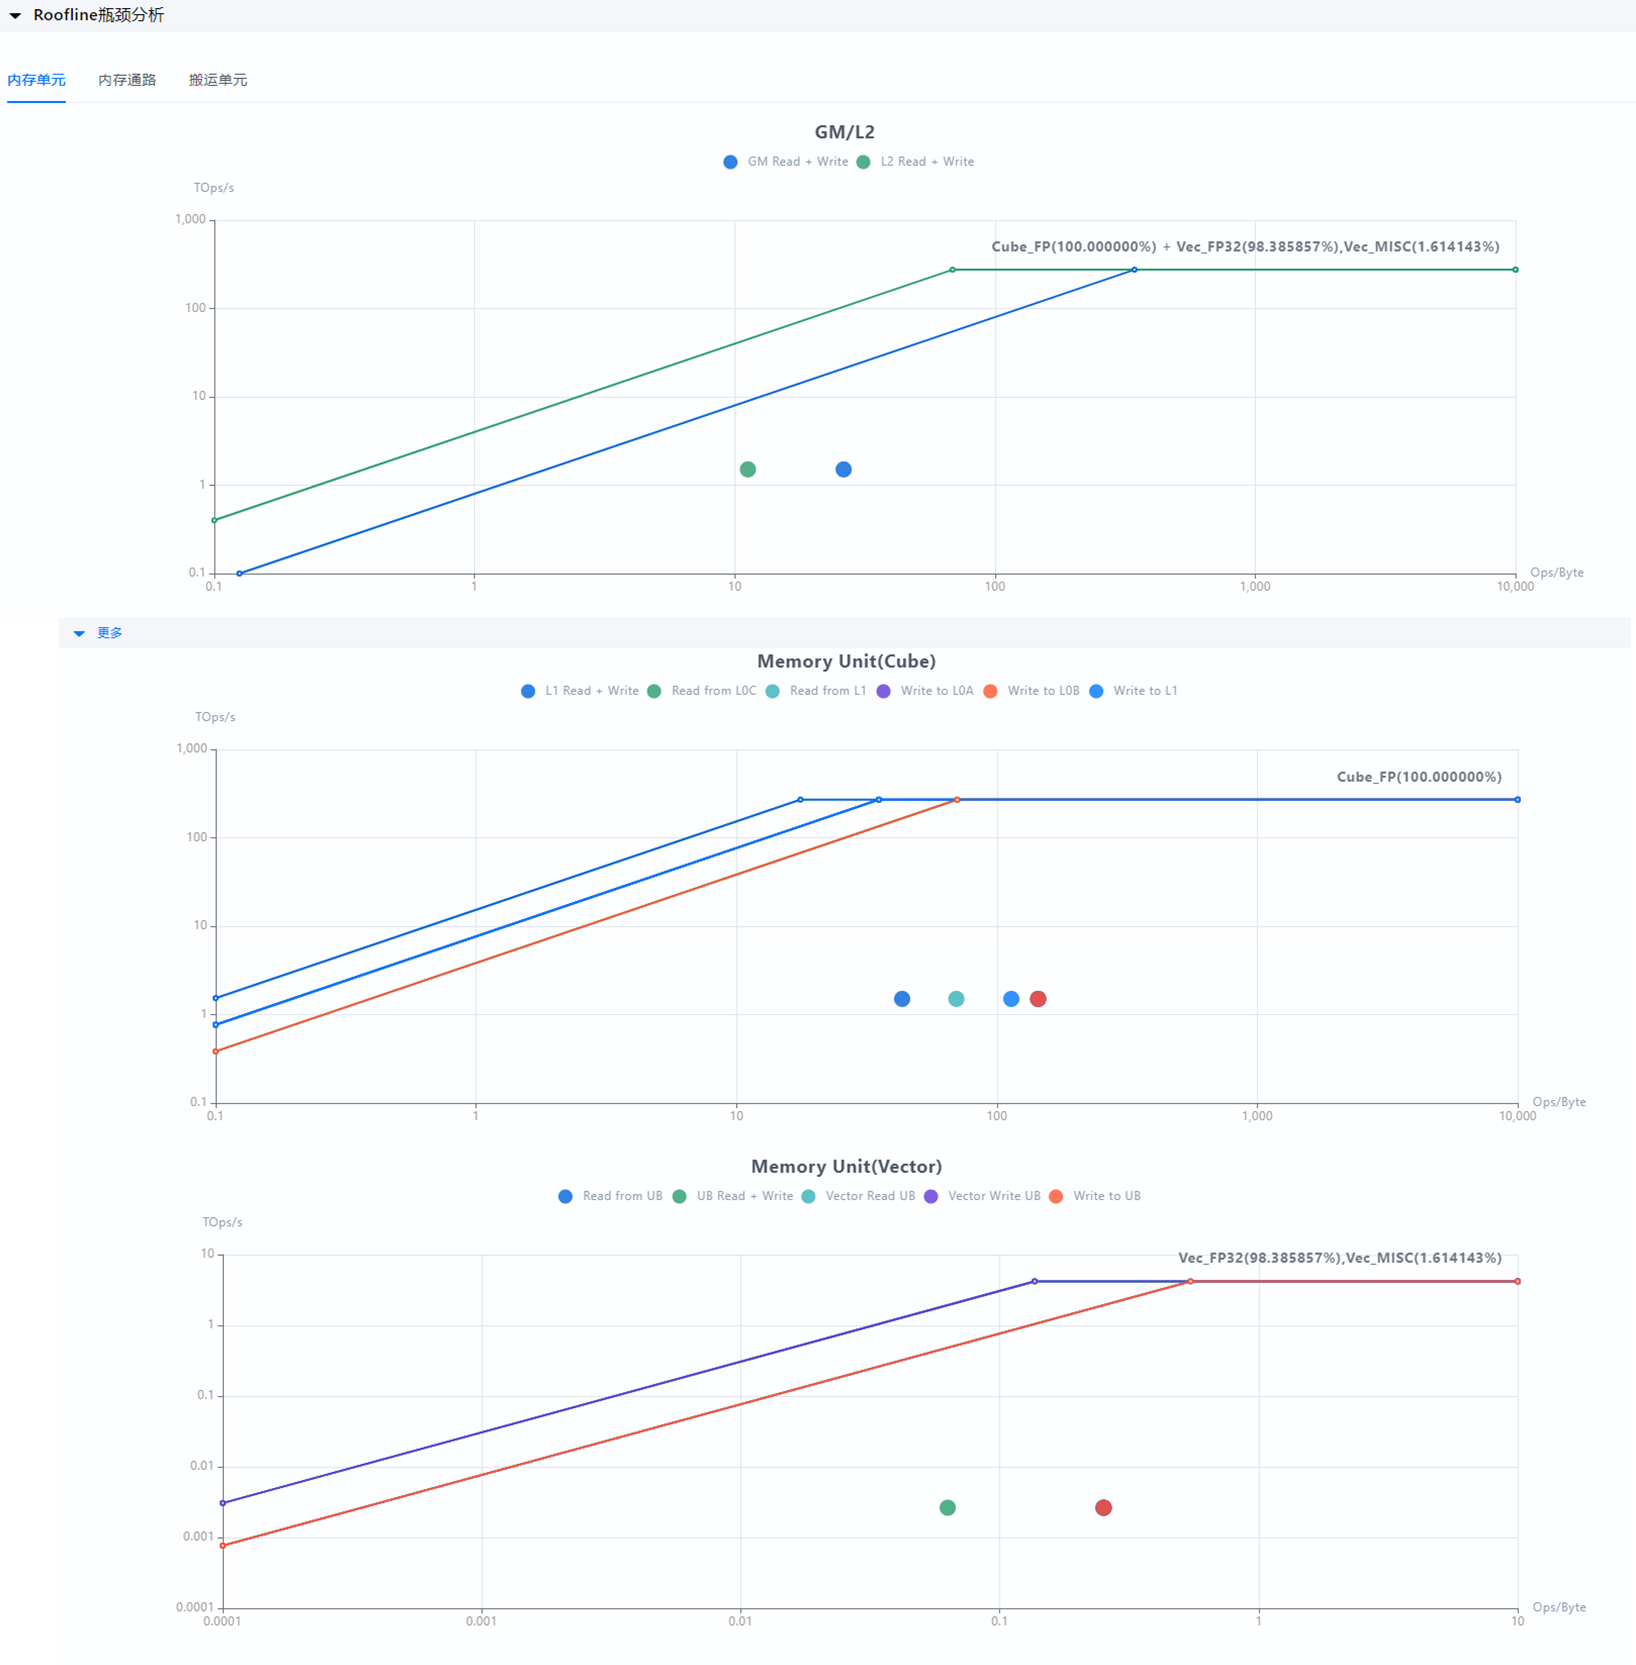
Table 1 Roofline chart support for Atlas A3 training products, Atlas A3 inference products, Atlas A2 training products, and Atlas A2 inference products
Roofline View Type
Vector Operator
Cube Operator
Mix Operator
GM/L2 chart
√
√
√
Vector memory unit view
√
-
√
Vector memory channel view
√
-
√
Vector pipeline view
√
-
√
Cube memory unit view
-
√
√
Cube memory channel view
-
√
√
Cube pipeline view
-
√
√
-
For
Ascend 950 products , different views are generated based on the operator type. For details, see Table 2 Roofline chart support forAscend 950 products .Figure 3 Roofline bottleneck analysis chart for
Ascend 950 products 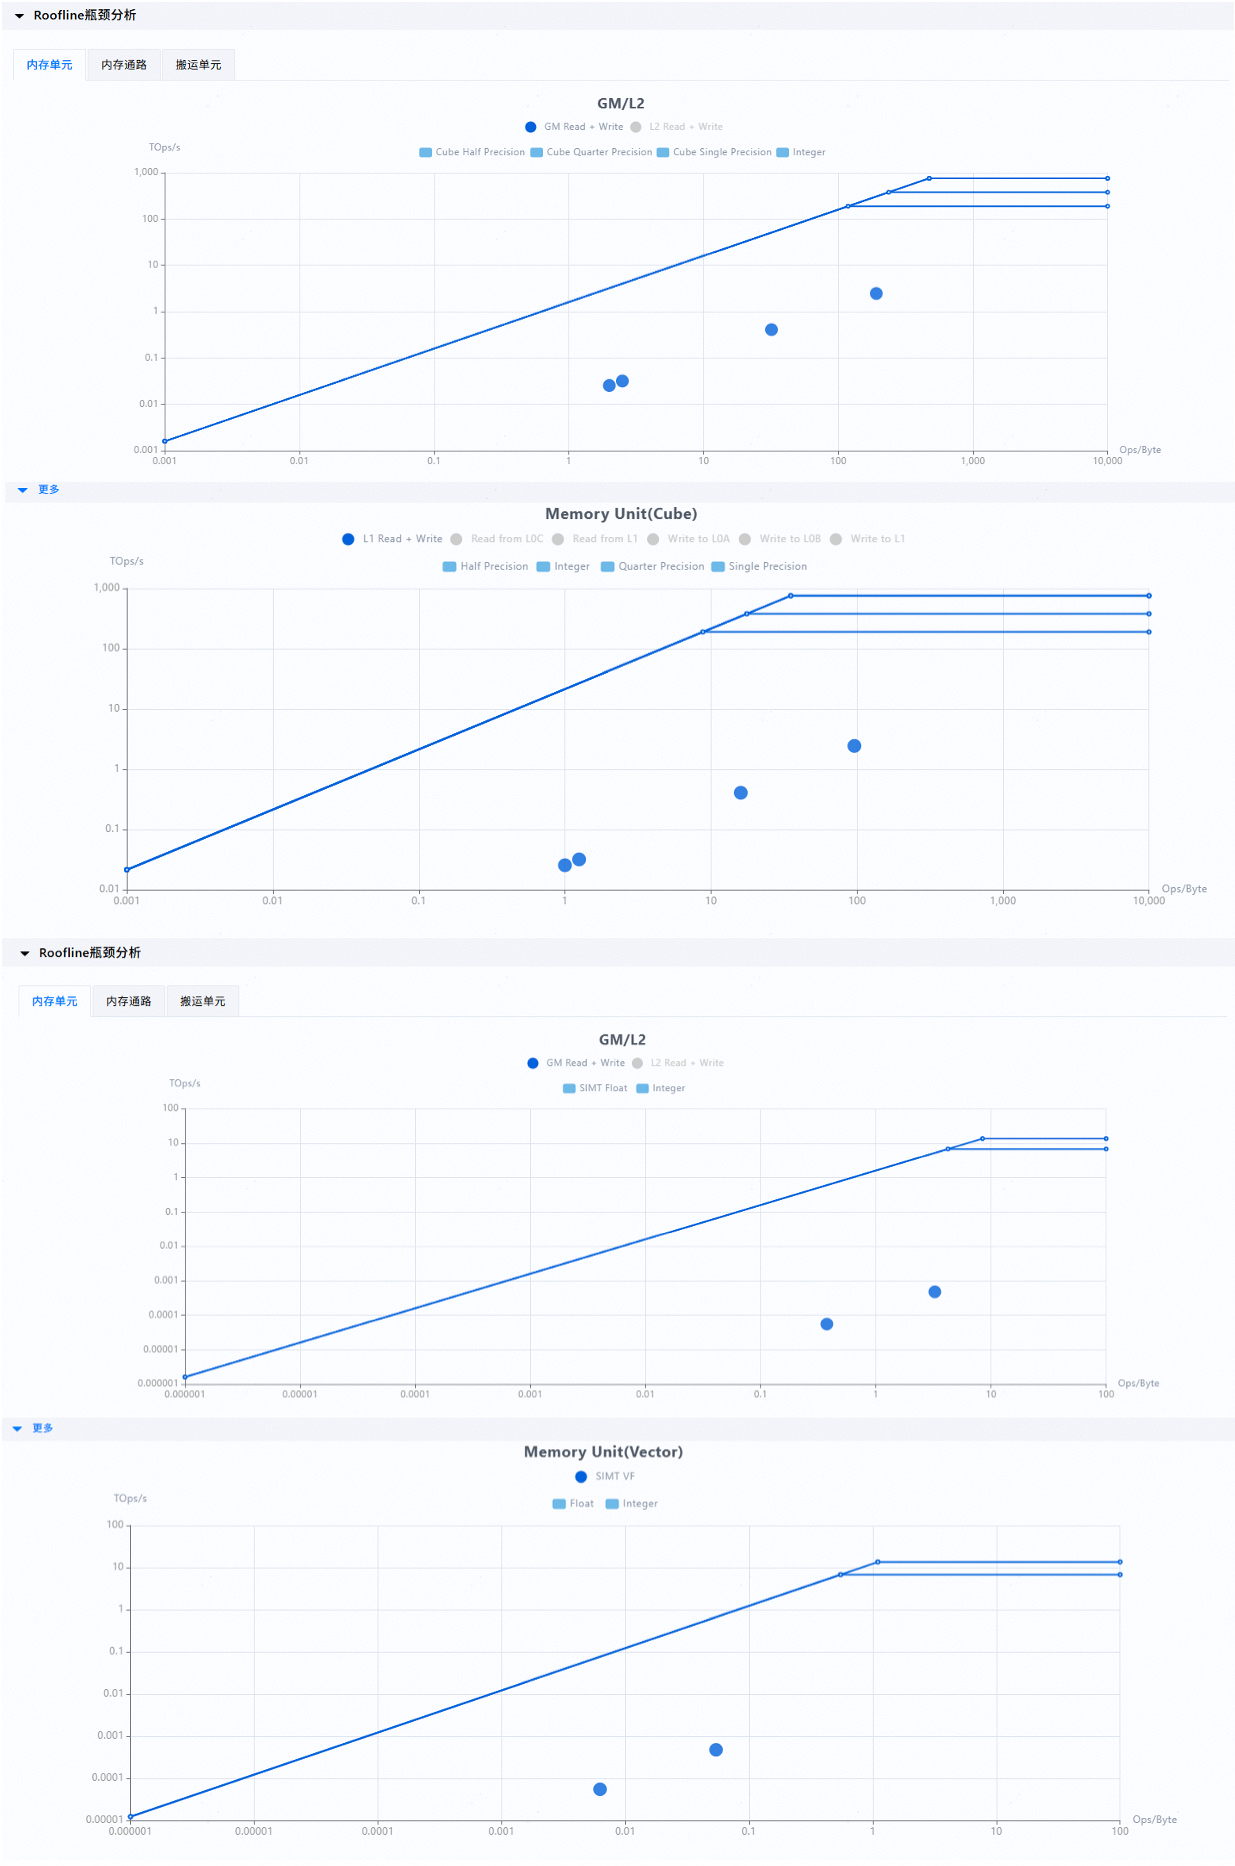
Table 2 Roofline chart support for
Ascend 520 products Roofline View Type
Vector Operator
Cube Operator
Mix Operator
GM/L2 view
√
√
√
Vector memory unit view
√
-
√
Cube memory unit view
-
√
√
Cube memory channel view
-
√
√
Cube pipeline view
-
√
√
[!NOTE]NOTE
The vector memory unit view of Ascend 950 products supports only the SIMT view.
Usage Instruction
The Roofline performance analysis result of each unit or channel consists of a horizontal axis, a vertical axis, a roofline, a bandwidth slope, and actual running coordinates. For details, see Figure 4 Roofline chart.

- Horizontal axis: arithmetic intensity, which is the ratio of total floating-point operations to total accessed data in a unit or channel, in Ops/Byte.
- Vertical axis: performance, which is the number of floating-point operations executable per second, in TOps/s.
- Roofline: The horizontal line at the top of the chart, representing the theoretical maximum computing performance of the NPU. Regardless of how the arithmetic intensity is improved, the actual performance cannot exceed the hardware limit.
-
Bandwidth slope: slope line that intersects with the roofline. Its intersection with the vertical axis depends on the theoretical maximum bandwidth. When the theoretical maximum bandwidth multiplied by the arithmetic intensity is less than the theoretical maximum computing performance of the NPU, the maximal computing power increases linearly with the arithmetic intensity.
[!NOTE]NOTE
The roofline and bandwidth slope together form the theoretical maximum computing power of an operator, which can be summarized asmin(NPU theoretical maximum computing performance, Theoretical maximum bandwidth * Actual arithmetic intensity). -
For parameters of actual running coordinates, see Table 3 Actual running coordinate parameters.
Table 3 Actual running coordinate parameters
Coordinate Parameter Description Bandwidth Theoretical maximum bandwidth of the unit or channel. Arithmetic Intensity Actual arithmetic intensity during operator running (horizontal coordinate). Performance Actual computing performance during operator running (vertical coordinate). Performance Ratio Ratio of actual computing performance to the theoretical maximum performance under current data volume ( a/bin the figure expressed as a percentage).
The Roofline analysis chart analyzes the performance percentage of operators and provides the following objective analysis results:
-
If the operator performance percentage is greater than 80%, a message is displayed based on the region.
- Compute Bound: computing bottleneck.
- Memory Bound: memory bottleneck.
-
If the operator performance percentage is less than 80% and the bound type is latency bound.
- If the maximum pipeline ratio is less than 80%, the message "latency bound:pipeline caused" is displayed.
-
If the maximum pipeline ratio is greater than 80%, identify the type of the maximum pipeline ratio.
-
If the type of the maximum pipeline ratio is compute pipeline (cube ratio, vector ratio, or scalar ratio), the message "latency bound:compute caused" is displayed.
[!NOTE]NOTE
Ascend 950 products support only the cube ratio and scalar ratio types. -
If the type of the maximum pipeline ratio is memory pipeline (MTE1 ratio, MTE2 ratio, or MTE3 ratio), the message "latency bound:memory caused" is displayed.
-
Cache Heatmap
Function Description
Displays the L2 cache heatmap using the L2 cache access data of kernel functions recorded by msOpProf. The heatmap displays the instruction information, allowing users to optimize the cache hit ratio and operator programs.
Precautions
- For detailed MindStudio Insight operations and field explanations, see Cache in MindStudio Insight Operator Tuning.
- If the
-gcompilation option is added, the generated binary file contains debugging information. You are advised to restrict access to user programs with debugging information to authorized personnel only. - If the functions provided by the llvm-symbolizer component are not used, do not include
-gwhen compiling the program that is input to msOpProf. In this case, msOpProf does not call the functions of the llvm-symbolizer component. - The cache heatmap function does not apply to
Atlas inference products . - The MC2 and LCCL operators do not support the generation of cache heatmaps.
Usage Description
The following figure shows the cache heat map.
Figure 1 Cache heatmap

- Hit indicates the cacheline hits, and Miss indicates the cacheline misses, allowing you to analyze the L2 cache usage.
-
On the Cache tab page, select a hit or miss event graph and click to enlarge the event graph. In the enlarged event graph, right-click the selected memory cell and choose Show Instructions in Source from the shortcut menu. The Source page is displayed, and the related instruction line is highlighted.
Figure 2 Operator code hot spot map corresponding to a cacheline

[!NOTE]NOTE
To jump from the cache heatmap to the operator code hot spot map, configure msopprof in advance as described in msOpProf Configuration.
Communication and Computing Pipeline Chart
Function Description
Visualizes the trace.json and visualize_data.bin files generated after an MC2 operator is tuned under the msOpProf mode. You can intuitively see operator running status and instruction time consumption, which helps identify operator bottlenecks. Performance annotation is supported through Ascend C APIs to collect actual execution time of code on operator blocks, used for analysis and optimization of communication and compute operators performance. Currently, only MC2 and LCCL operators and ASC operators are supported.
Precautions
- For detailed MindStudio Insight operations and field explanations, see Timeline in MindStudio Insight Operator Tuning.
- If the
-gcompilation option is added, the generated binary file contains debugging information. You are advised to restrict access to user programs with debugging information to authorized personnel only. - When the on-board pipeline chart function is used in the KFC scenario, comply with the related API usage rules. In some scenarios, data on the Cube cannot be displayed. You need to view the operator marking data based on the KFC API principles.
Usage Description
The trace.json file can be visualized using either the Chrome browser or MindStudio Insight, while the visualize_data.bin file can be visualized only using MindStudio Insight. For details about how to use the AscendC API for performance profiling, see Debugging APIs > On-board Printing > PrintTimeStamp in Ascend C Operator Development API.
-
Chrome
Enter chrome://tracing in the address box of Chrome, drag the generated instruction pipeline file (
trace.json) to the blank area to view the file. Use the keyboard shortcuts to navigate:W(zoom in),S(zoom out),A(pan left), andD(pan right). For details about the key fields, see Table 1 Key fields.Field Description MC2 Operator LCCL Operator ASC Operator AI CORE Overall running status of the operator on the AI Core. Supported. Supported Not supported AI CPU Overall running status of the operator on the AICPU. Supported Not supported Not supported TURN Pipeline of the operator on the AICPU at different communication rounds. Supported Not supported Not supported AIC BLOCK Overall running status and key API calls of the operator on each Cube core of the AI Core. Supported Supported Supported AIV BLOCK Overall running status and key API calls of the operator on each Vector core of the AI Core. Supported Supported Supported HCCL Collective communication pipeline between multiple devices for operators communicating via HCCL. Supported Not supported Not supported HCCL TASK Collective communication task execution pipeline between multiple devices for operators communicating via HCCL. Supported Not supported Not supported AscendC API Execution time of user Ascend C API calls on each block Supported Not supported Supported -
MindStudio Insight
Visualizes the generated
trace.jsonorvisualize_data.binfiles.Figure 1 Communication and computing pipeline chart
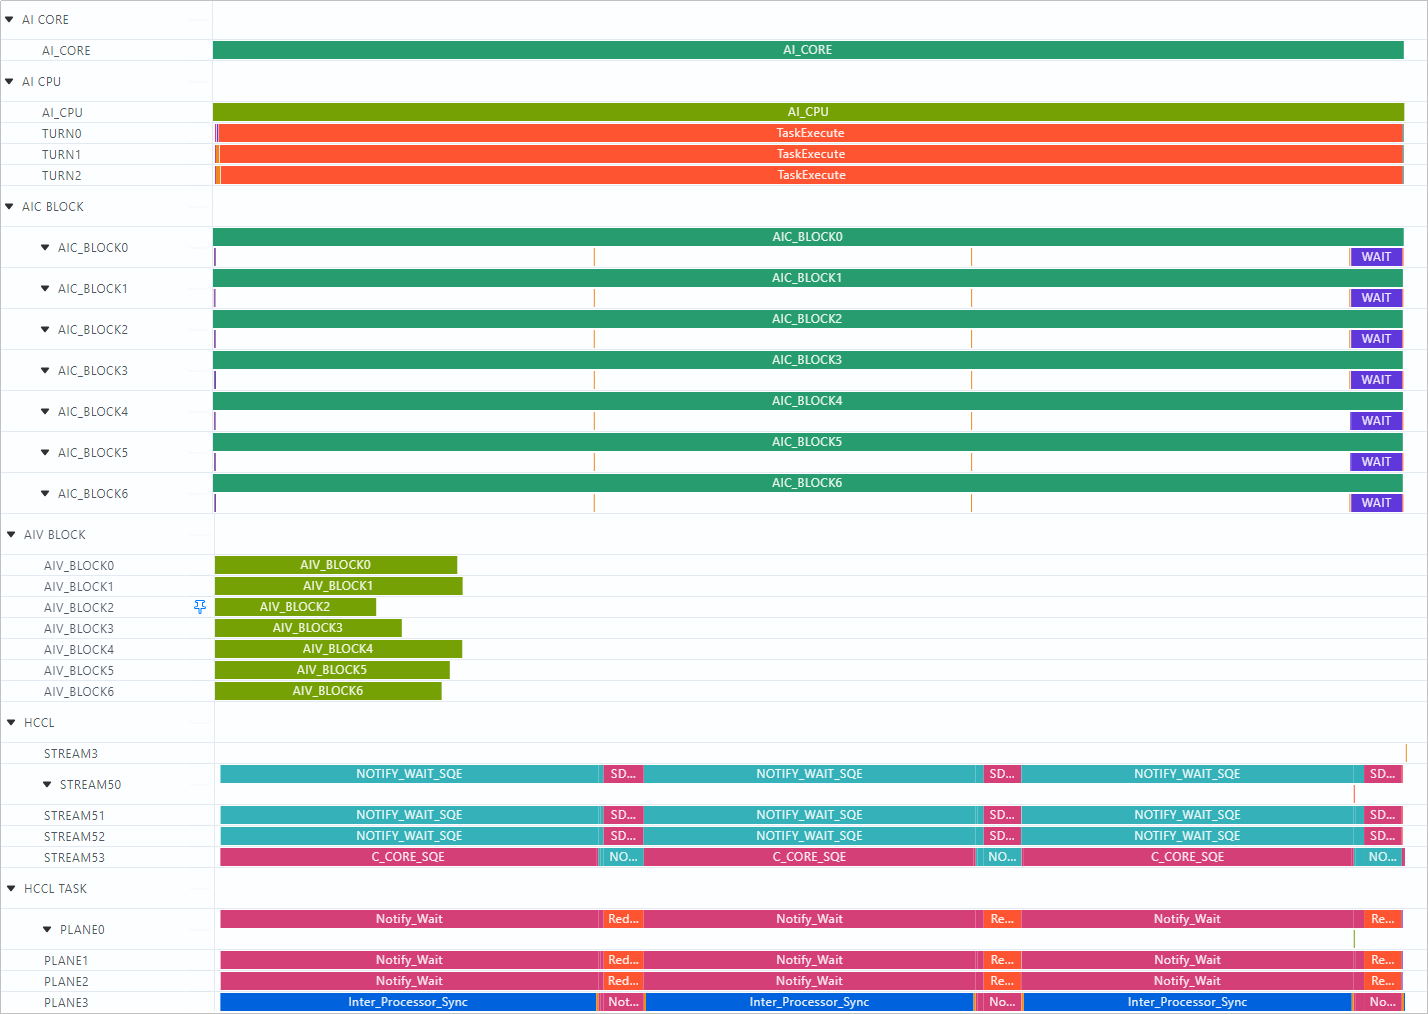
- Displays the time consumption masking of the operator on the AICPU and AI Core to assess the MC2 operator performance.
- Displays the pipeline of operators on the AICPU at different communication rounds.
- Displays the running time and key API call pipeline of the operator on each block.
-
Displays collective communication pipeline and task pipeline during multi-device running of operators communicating via HCCL.
[!NOTE]NOTE
- The MC2 operator can call the AllReduce, AllGather, ReduceScatter, and AlltoAll interfaces of the
Atlas A2 training products and Atlas A2 inference products and the AllGather, ReduceScatter, and AlltoAllV interfaces of theAtlas A3 training products and Atlas A3 inference products . For details, see Advanced API > Hccl > APIs on the HCCL Kernel Side in the Ascend C Operator Development API. After the-gcompilation option is added, click a specific API to associate the code call stack. - For support of MC2, LCCL, and common operators, see Table 1 Key Fields.
- The MC2 operator can call the AllReduce, AllGather, ReduceScatter, and AlltoAll interfaces of the
Figure 2 Operator execution time diagram
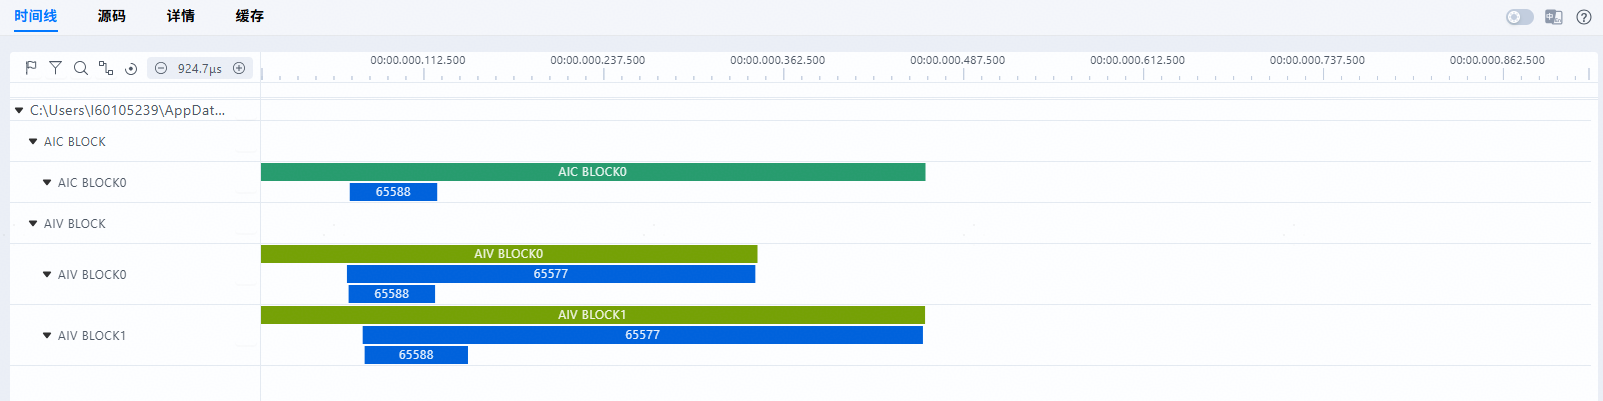
By using the profiling API with the same
descidto make two marks on the operator kernel side, the tool will plot the operator execution time for each block between these two marks.
Pipeline Chart
Function Description
Visualizes the trace.json and visualize_data.bin files generated after an operator is tuned. You can intuitively see the running status of each pipeline, which helps identify operator bottlenecks.
For detailed MindStudio Insight operations and field explanations, see Timeline in MindStudio Insight Operator Tuning.
Usage Description
- The generated
visualize_data.binfile can be visualized using MindStudio Insight. The following figure shows the active status of each AI Core unit of the operator. - The pipeline chart feature is implemented based on sampling and is not directly related to the number of cores enabled by the user. Even if all cores are enabled, only the data of six cores is displayed.
- If data loss occurs when MarkStamp is used for for marking, you are advised to reduce the number and density of mark points.
Figure 1 Pipeline chart
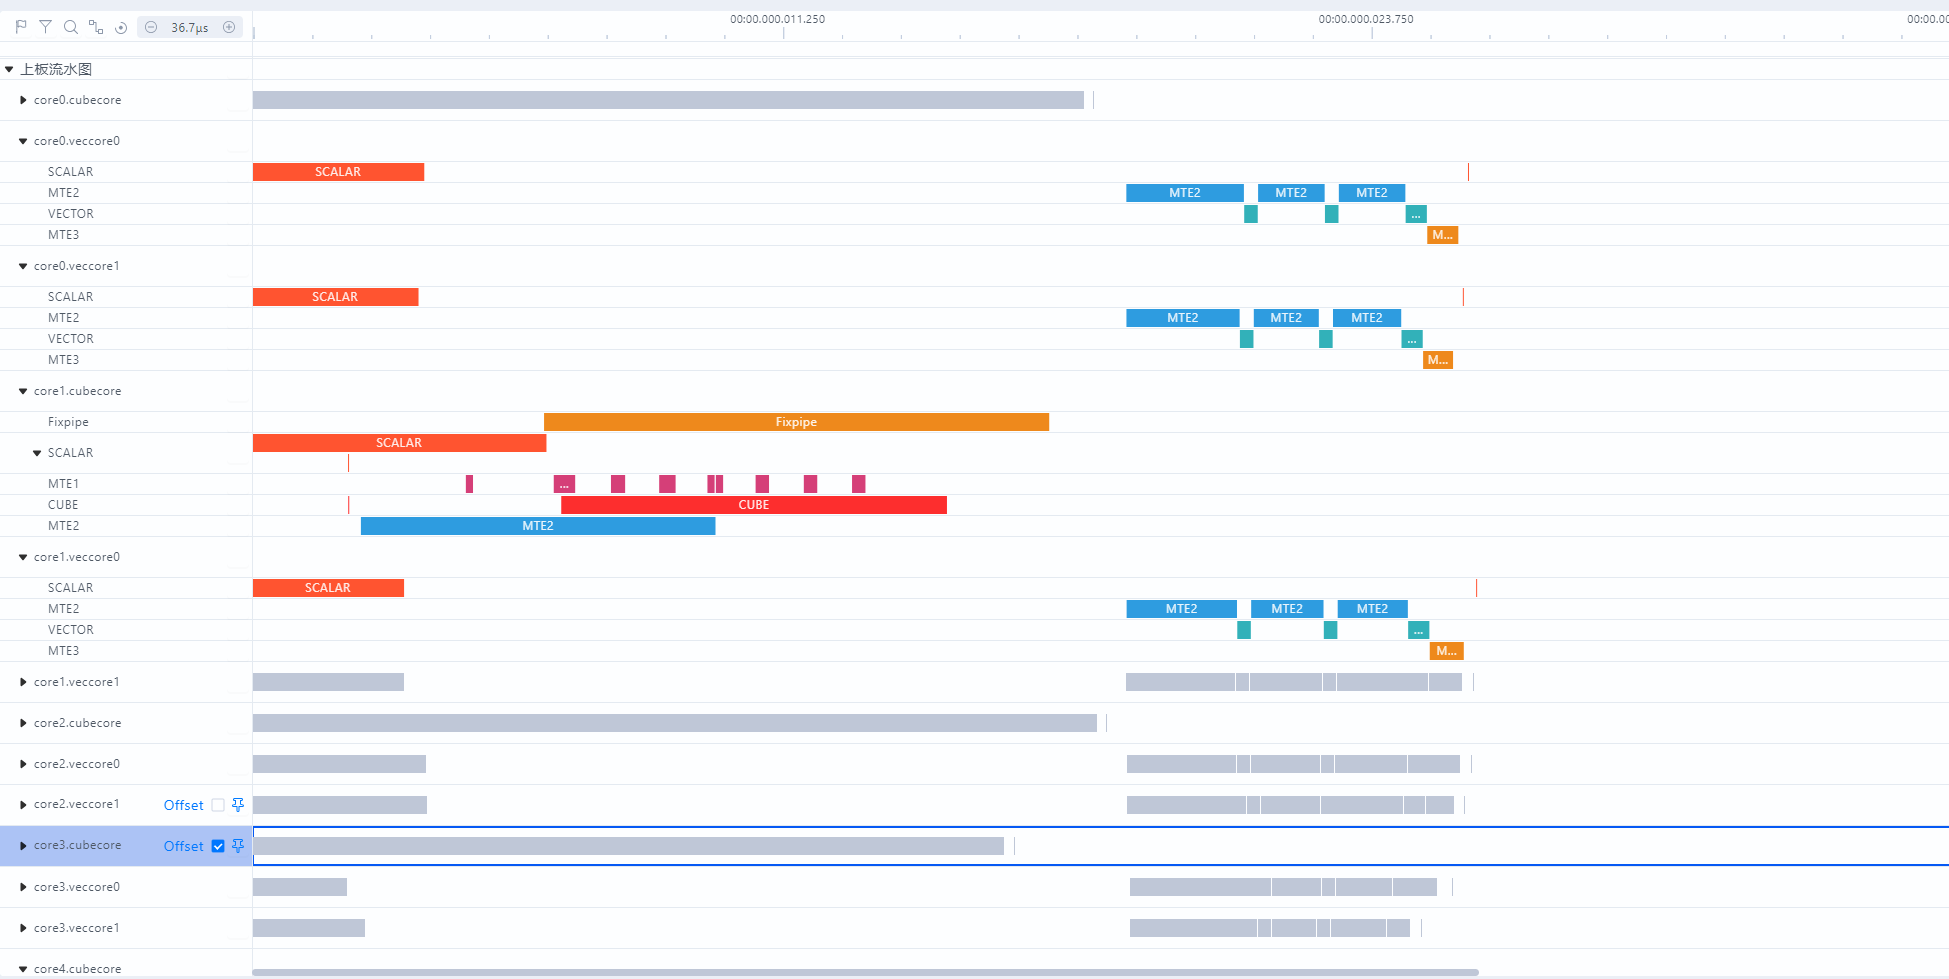
You can use the AscendC::MarkStamp API to perform pipeline marking at any point in the operator kernel code to identify the pipeline range. If a point with ID 13 is marked on the Vector core using this API, MarkStamp13 will be displayed on the Scalar and Vector units in the chart. For details, see Figure 2 Custom Marking Chart.

[!NOTE]NOTE
- Marking on the Scalar unit generates only one record, representing both issuing and execution. Marking on other units generates two records: one on the Scalar unit for issuing and one on the corresponding unit for execution.
- SIMT functions do not support marking.
Operator Code Hot Spot Map
Function Description
Visualizes the visualize_data.bin files generated by msOpProf. On the page, you can view the mapping between operator source code and instructions, as well as the time consumption. This helps developers identify hot spot code distribution and analyze the feasibility of hot spot function optimization.
Precautions
- For detailed MindStudio Insight operations and field explanations, see Source in MindStudio Insight Operator Tuning.
- If the
-gcompilation option is added, the generated binary file contains debugging information. You are advised to restrict access to user programs with debugging information to authorized personnel only. - The operator program must be compiled with the
-goption. Otherwise, msOpProf will not display the hot spot map and will not call the relevant functions of the llvm-symbolizer component to implement code-to-PC mapping. - This function does not apply to
Atlas inference products . - Operator code hotspot maps cannot be generated for MC2 or LCCL operators.
Usage Description
The following figure shows the operator code hotspot map.
Figure 1 msOpProf source code page

- On the top of the page, you can switch between compute units and kernel function files.
- The left pane shows the L2 cache hit ratio, GM-related data transfer, and instruction count for each line of the operator kernel function code, making it easier to identify bottlenecks.
- The right pane shows the L2 cache hit ratio, GM-related data transfer, runtimes, and code associations by instruction, helping developers find out why code runs slowly.
-
For differences between L2 cache hit rate on timeline and details pages of MindStudio Insight, see Table 1 Comparison of L2 cache hit rate in MindStudio Insight.
Table 1 Comparison of L2 cache hit rate in MindStudio Insight
Page Data Source Dimension Timeline Tool simulation Code lines and instructions Details Real data Kernel [!NOTE]NOTE "NA" is displayed if no GM-related unit is involved when Process Bytes is checked.
-
For details about the features supported by msOpProf, see Table 2 msOpProf hot spot map features and Table 3 Stall description.
Table 2 msOpProf hot spot map features
Column Atlas A2 training products/Atlas A2 inference products Atlas A3 training products/Atlas A3 inference products Atlas inference products Ascend 950 products Description Source Code Supported Supported Not supported Supported - Instruction PC Address Supported Supported Not supported Supported - PIPE Supported Supported Not supported Supported - Execution Times Supported Supported Not supported Supported Execution count of operator source code and instructions. GPR Count Not supported Not supported Not supported Supported Register usage.
Register usage for certain operators using theTRACE_STARTandTRACE_STOPAPIs cannot be displayed.GPR Status Not supported Not supported Not supported Supported Register usage status.
Currently, there are five register states:Space=0(not displayed in the visualization tool),Read=1(right hollow arrow),Write=2(left solid arrow),ReadAndWrite=3(left solid arrow and right hollow arrow), andInUsed=4(vertical line).L2 Cache Hit Rate Supported Supported Not supported Not supported Simulated results in dimensions of code lines and instructions. Process Bytes Supported Supported Not supported Supported GM-related data transfer volume. Stall Sampling(All Samples) Not supported Not supported Not supported Supported Number of waiting times incurred during instruction execution due to resource conflicts, data dependencies, or other reasons, including active.Stall Sampling(Not Issue) Not supported Not supported Not supported Supported Number of waiting times incurred during instruction execution due to resource conflicts, data dependencies, or other reasons, excluding active.Name Description Stall_Cycles (NOP Stall) Stall cycles caused by NOP instructions. Stall_Divergence_Stack_Spill (Divergence Stack Overflow Stall) Pipeline stall cycles caused by inconsistent predicted and actual execution paths due to insufficient stack space or branch paths during branch instruction execution. Stall_IBuf_Empty (IBuf Empty Stall) Pipeline stall cycles caused by failure to obtain the next instruction when IBuf is empty. Stall_Others (Other Stalls) Pipeline stall cycles triggered by other exceptions or control logic except identified reasons. Stall_Register_bank_conflict (Register Conflict Stall) Stall cycles where the pipeline pauses to avoid data errors when instructions access the same register bank at the same time. Stall_Resource_conflict (Resource Conflict Stall) Pipeline stall cycles where multiple instructions compete for the same hardware resource and cannot be executed in parallel. Stall_Scoreboard_Not_Ready (Scoreboard Not Ready Stall) Pipeline stall where the current instruction cannot proceed because the Scoreboard status is not ready (for example, previous instructions are still occupying resources or registers). Stall_Warp_Level_Sync (Warp-Level Sync Stall) Instruction execution stall used to ensure thread synchronization and consistency in a Warp during multi-thread execution when synchronization conditions are not met. active Number of times that instructions are successfully issued without stalls.