基于Linux Kernel Trace的Host Bound问题分析
问题背景
在大模型中,CPU主要负责任务的下发,NPU负责任务执行。在现网问题中,无论推理或训练领域,HostBound都是现网的高发问题。
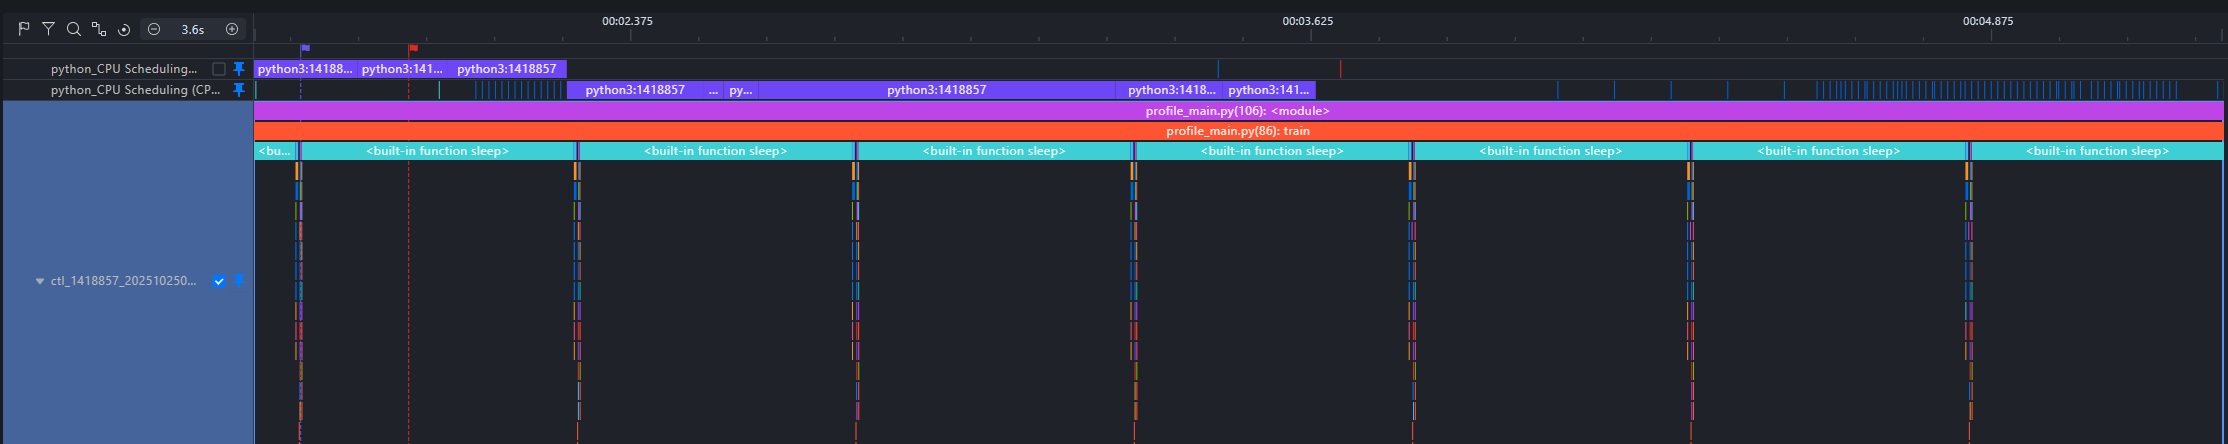
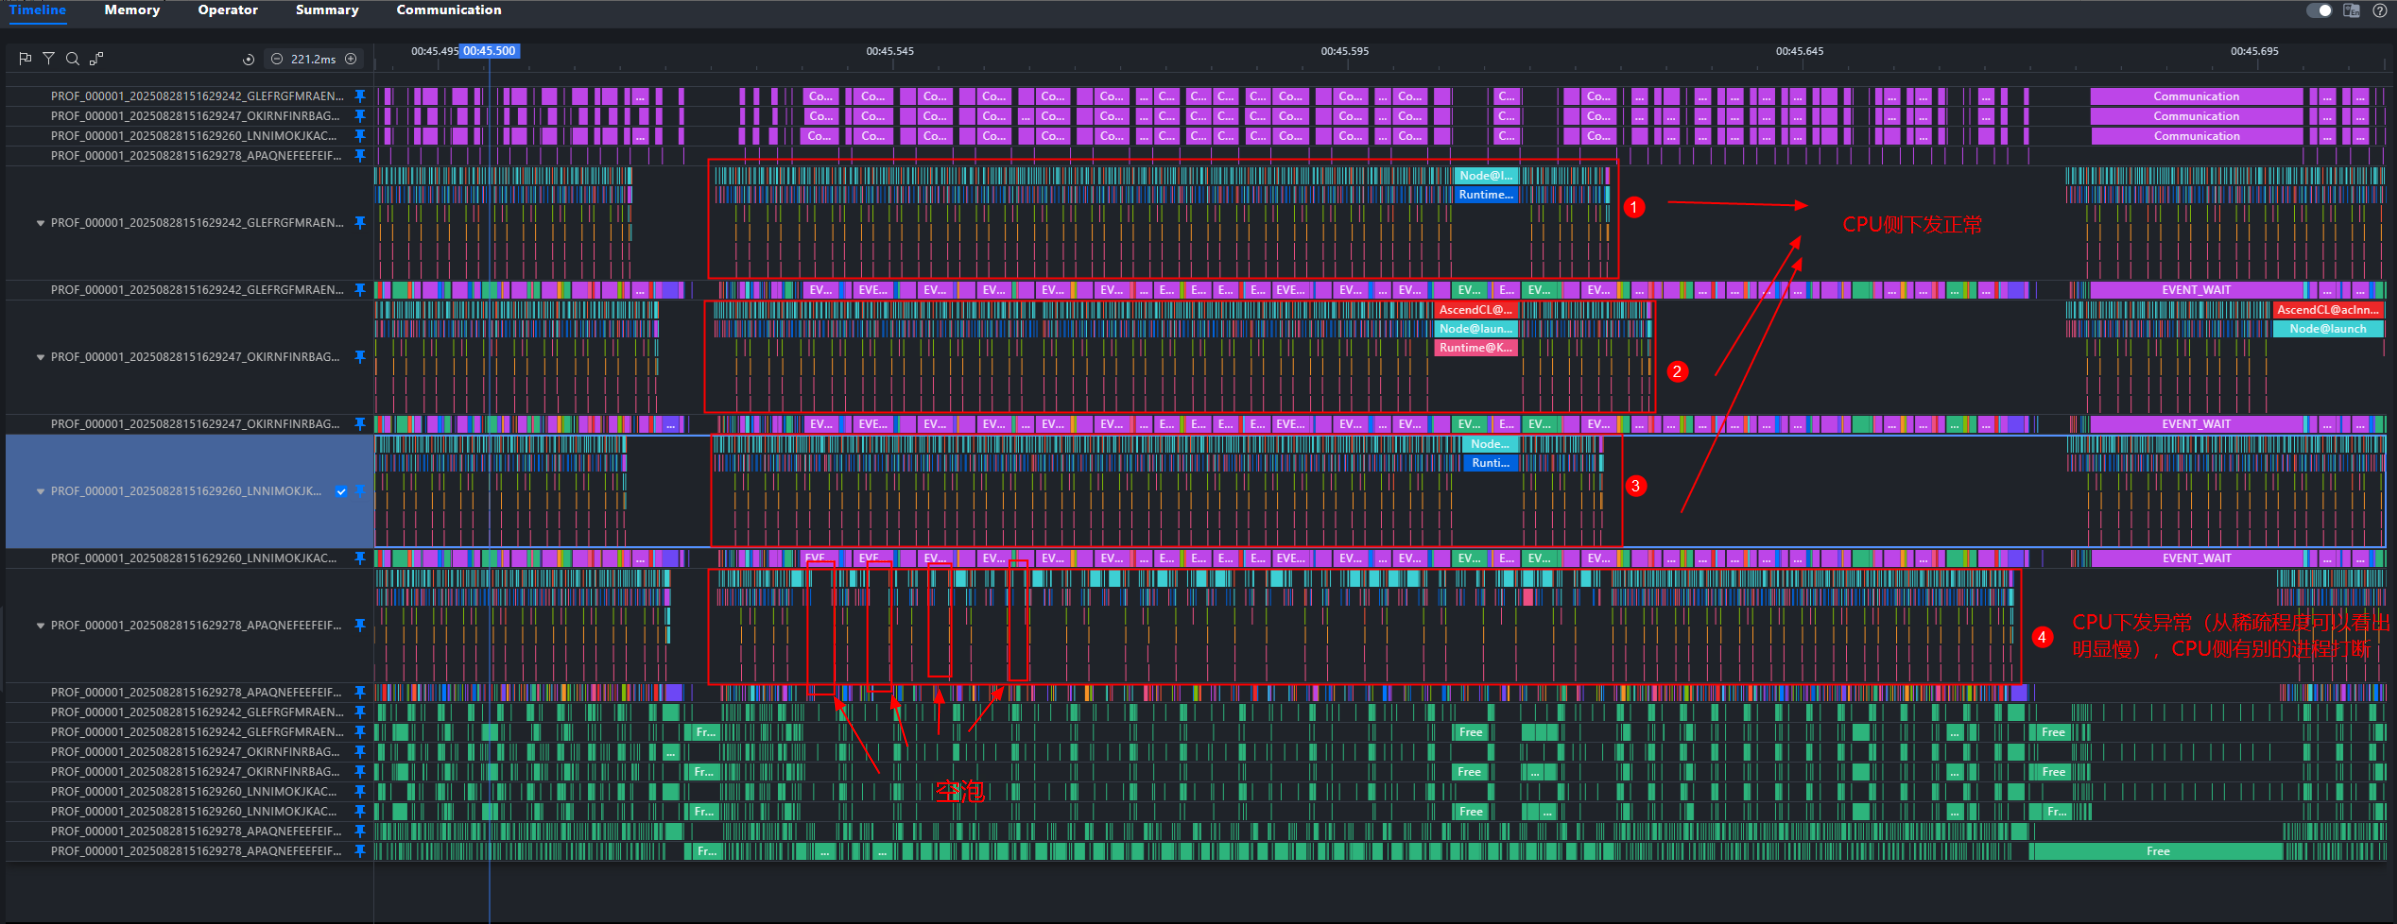
HostBound模型在Profiling中经常表现为下发时间长,Device和Host侧对应出现大量空泡,如下图所示:
 HostBound问题通常会采集ftrace数据分析CPU调度问题,但缺乏工具将ftrace的数据和profiling的信息整合。MindStudio Insight提供了工具脚本实现两种数据同时展示,提高HostBound问题定位的效率。
定位思路
- 绑核、流水优化、内存分配库替换三板斧
- 同时采集ftrace和profiling数据(容器场景下,ftrace和profiling应在同一容器内执行)
- 将ftrace数据转换为MindStudio Insight可识别的数据
- 同时导入MindStudio Insight 分析进程调度情况
模型Profiling数据采集
参考: msprof采集通用命令-CANN商用版8.2.RC1-昇腾社区 (hiascend.com) PyTorch训练/在线推理场景性能分析-昇腾社区 (hiascend.com)
Linux Kernel ftrace数据采集
1、Linux Kernel ftrace数据介绍
Linux 内核内置了多种跟踪(trace)工具,其中 ftrace 作为从 2.6.27 版本开始引入主流内核的跟踪框架,可用于看管和调试内核中发生的各类事件,帮助开发人员深入分析系统运行时的内部行为。ftrace 支持多种跟踪器,例如函数调用跟踪、上下文切换跟踪、中断延迟分析等,能够有效辅助定位内核态性能问题与调度异常。在如下示例中,我们仅开启了与 CPU 进程调度相关的事件(sched)进行数据采集,具体输出如下:
# tracer: nop
#
# entries-in-buffer/entries-written: 112246/112246   #P:192
#
#                                _-----=> irqs-off
#                               / _----=> need-resched
#                              | / _---=> hardirq/softirq
#                              || / _--=> preempt-depth
#                              ||| / _-=> migrate-disable
#                              |||| /     delay
#           TASK-PID     CPU#  |||||  TIMESTAMP  FUNCTION
#              | |         |   |||||     |         |
   kworker/145:1-1023940 [145] d.... 1725926.126419: sched_stat_runtime: comm=kworker/145:1 pid=1023940 runtime=23230 [ns] vruntime=3450824076020452 [ns]
   kworker/145:1-1023940 [145] d.... 1725926.126423: sched_switch: prev_comm=kworker/145:1 prev_pid=1023940 prev_prio=120 prev_state=I ==> next_comm=release_thread next_pid=2813514 next_prio=120
  release_thread-2813514 [145] d.... 1725926.126427: sched_stat_runtime: comm=release_thread pid=2813514 runtime=8880 [ns] vruntime=468045121382 [ns]
  release_thread-2813514 [145] d.... 1725926.126429: sched_switch: prev_comm=release_thread prev_pid=2813514 prev_prio=120 prev_state=S ==> next_comm=swapper/145 next_pid=0 next_prio=120
          <idle>-0       [145] d.h.. 1725926.126478: sched_waking: comm=release_thread pid=2813514 prio=120 target_cpu=145
          <idle>-0       [145] dNh.. 1725926.126480: sched_wakeup: comm=release_thread pid=2813514 prio=120 target_cpu=145
          <idle>-0       [145] d.... 1725926.126485: sched_switch: prev_comm=swapper/145 prev_pid=0 prev_prio=120 prev_state=R ==> next_comm=release_thread next_pid=2813514 next_prio=120
各种事件代表不同的含义,主要的几种事件如下:
- sched_switch: 记录每次进程上下文切换,包括当前进程换出,新进程换入
- sched_wakeup: 已有进程被唤醒
- sched_wakeup_new: 新创建的进程首次被唤醒
- sched_process_fork/sched_process_exec/sched_process_exit :进程创建销毁
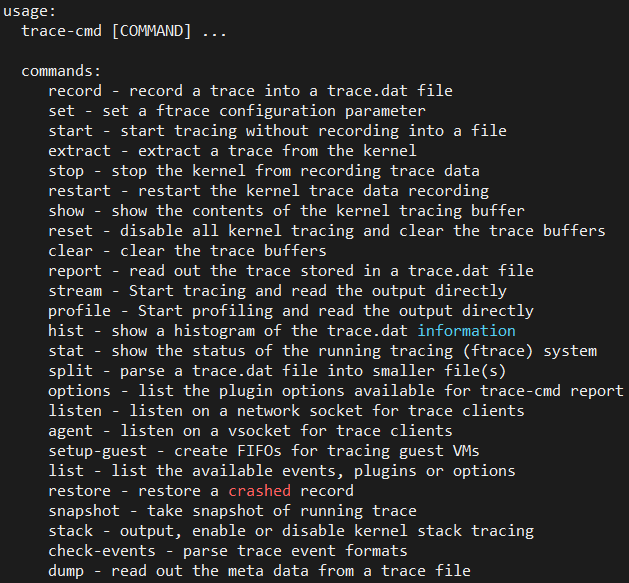
trace-cmd是 ftrace 的一个前端命令行工具。它封装了直接操作 /sys/kernel/debug/tracing/ 下复杂文件的过程,提供了更简单易用的命令接口
2、Linux Kernel数据采集操作
前置准备
- 安装trace-cmd命令
Ubuntu安装命令:
sudo apt-get install trace-cmdCentOS安装命令:sudo yum install trace-cmd - 获取MindStudio Insight提供的采集脚本trace_record.py(见附件),推荐profiling和ftrace数据同步采集
非侵入式采集
这种方式不需要修改现有代码,将trace_record.py脚本作为整体使用。优点在于无需修改代码,快速上手,但是同时灵活性较低。 作为整体脚本使用时提供以下参数:
usage: trace_record.py [-h] [--cpu CPU] [--output OUTPUT] --record_time RECORD_TIME

options:
  -h, --help            show this help message and exit
  --cpu CPU
  --output OUTPUT
  --record_time RECORD_TIME
                        record time, if pass <=0 will start long term record that user should attention the disk space
- cpu: cpu_mask列表,多个cpu使用逗号分割,例如采集0,1,4则传入--cpu=0,1,4
- output: 输出的文件名
- record_time:采集的时间,单位秒。如果传递小于等于0的数字,则会持续采集,直到使用ctrl-c终止进程
Example:
- 在终端中启动训练脚本
python train.py - 同时在另一终端中启动采集脚本,采集60s,
python trace_record.py --record_time=60
侵入式采集
利用trace_record脚本中提供的接口,在代码对应位置调用接口。优点在于灵活性高,可对特定的逻辑进行采集。
开始采集接口:
函数作用:打开ftrace采集开关 函数的参数说明: cpu_list:cpu采集列表,用于指定需要采集的cpu,默认传None,表示采集所有CPU的数据。格式采取数组形式,数组内容为CPU编号,例如指定采集CPU1和CPU4,则传入[1, 4]。
停止采集保存数据接口
函数作用:关闭ftrace采集开关,并将数据写入指定的output文件中,注意数据保存需要一定时间,会阻塞线程 record脚本中两个接口可以在任意代码中添加,也可以作为整体脚本使用。
Example: 在代码中中profiling开关开启/关闭处添加采集开始/结束接口调用
import ftrace_record
    ftrace_record_start(cpu=[0, 1, 4])
    profiling_start()
    train()
    profiling_stop()
    ftrace_record_stop(output='/tmp/ftrace.txt')
3、数据采集后处理
MindStudio Insight提供了ftrace格式数据,转换为流水图数据脚本trace_convert.py(见附件),使用方法如下:
root@uboot:/home# python trace_convert.py --help
usage: trace_convert.py [-h] [--input INPUT] [--output OUTPUT] [--cpu_list CPU_LIST] [--profiling_data PROFILING_DATA]
options:
  -h, --help            show this help message and exit
  --input INPUT
  --output OUTPUT
  --cpu_list CPU_LIST
  --profiling_data PROFILING_DATA
                        use profiling data to adjust start time
参数说明:
--input: 输入的ftrace数据文件路径
--output:输出的JSON格式文件路径
--cpu_list: 过滤指定的cpu,建议在采集时指定cpu_list,而非采集后转换时指定
--profiling_data :采集步骤中采集的profiling数据,用于ftrace数据的时间轴对齐
Example:
假设第一步采集的profiling数据在目录 result_dir/ctl_1418857_20251025030529768_ascend_pt下,对应的ftrace文件保存在result_dir/ftrace.txt中
执行命令:python trace_convert.py --input=result_dir/ftrace.txt --profiling_data=result_dir/ctl_1418857_20251025030529768_ascend_pt
联合分析
- 在MindStudio Insight中导入profiling数据
- 在工程管理中向当前工程添加转换后的结果文件,就可以得到两种数据并存的流水图
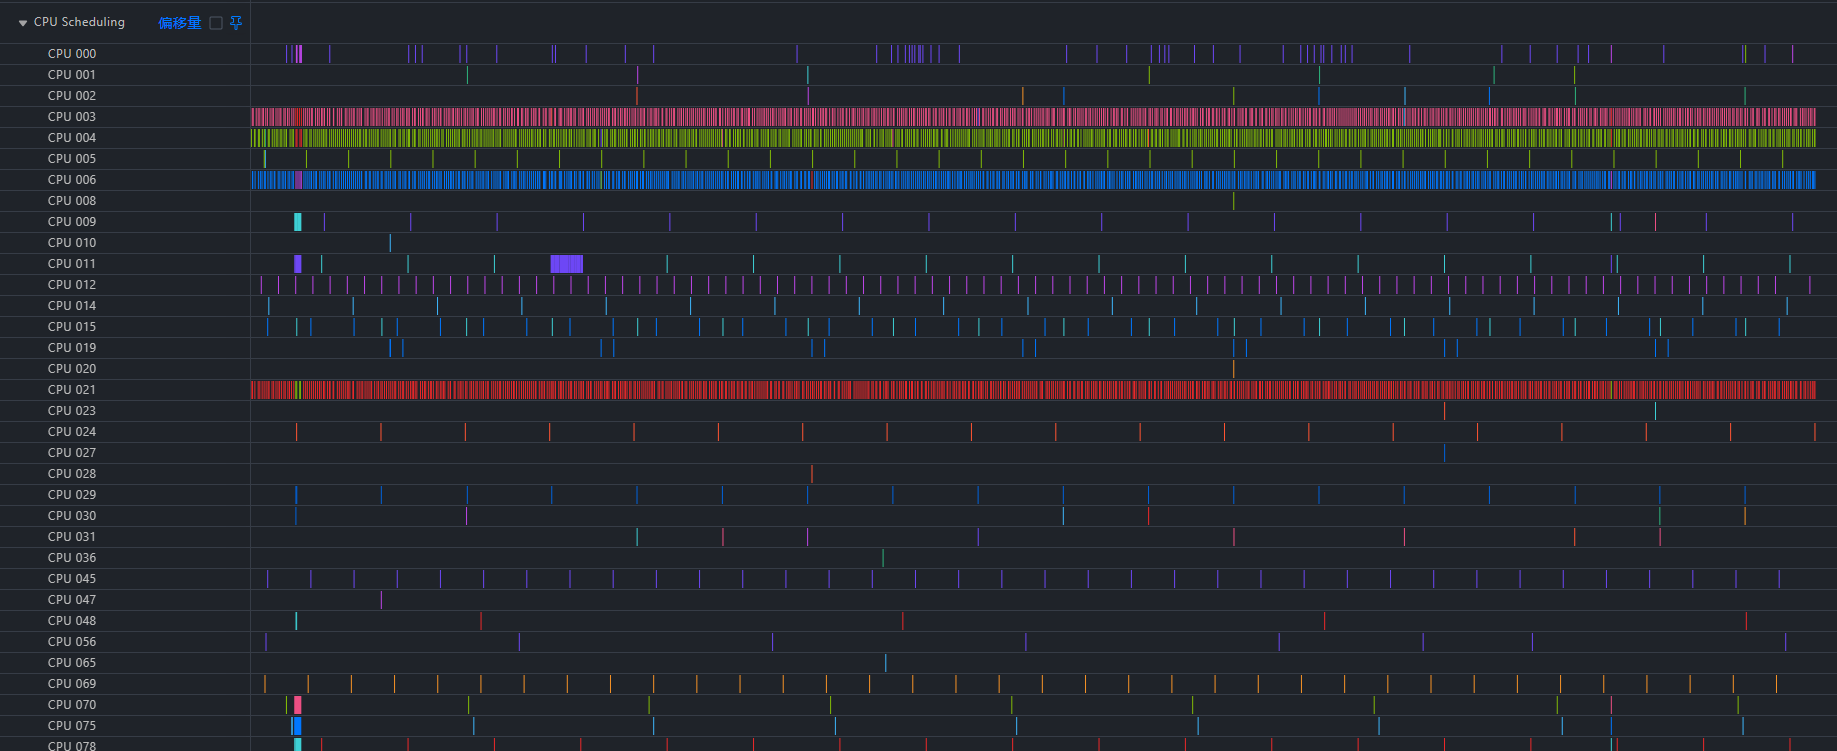
 3. 查看CPU侧调度情况, 查看CPU Scheduling泳道
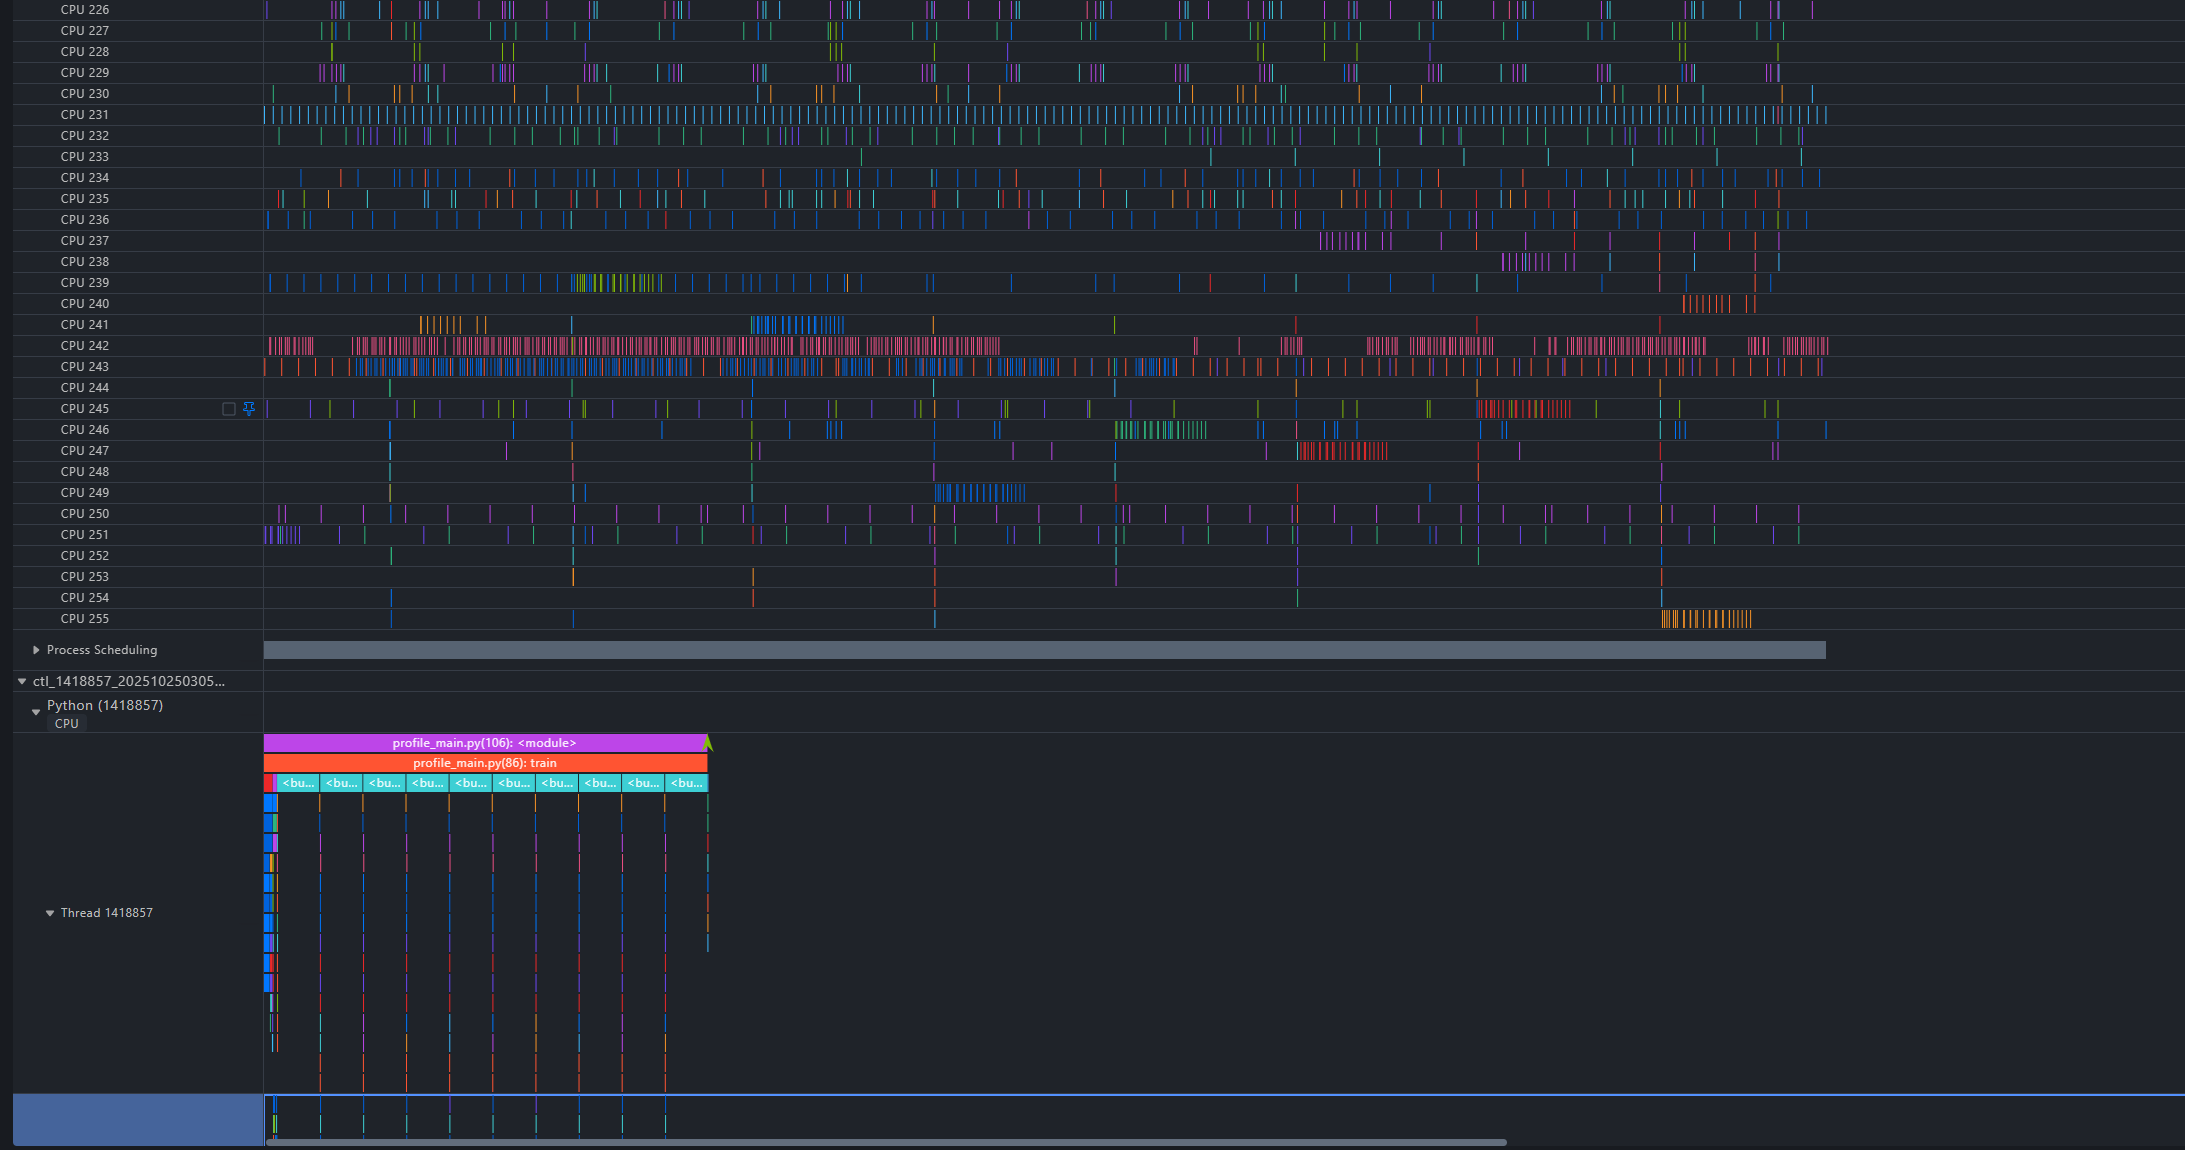
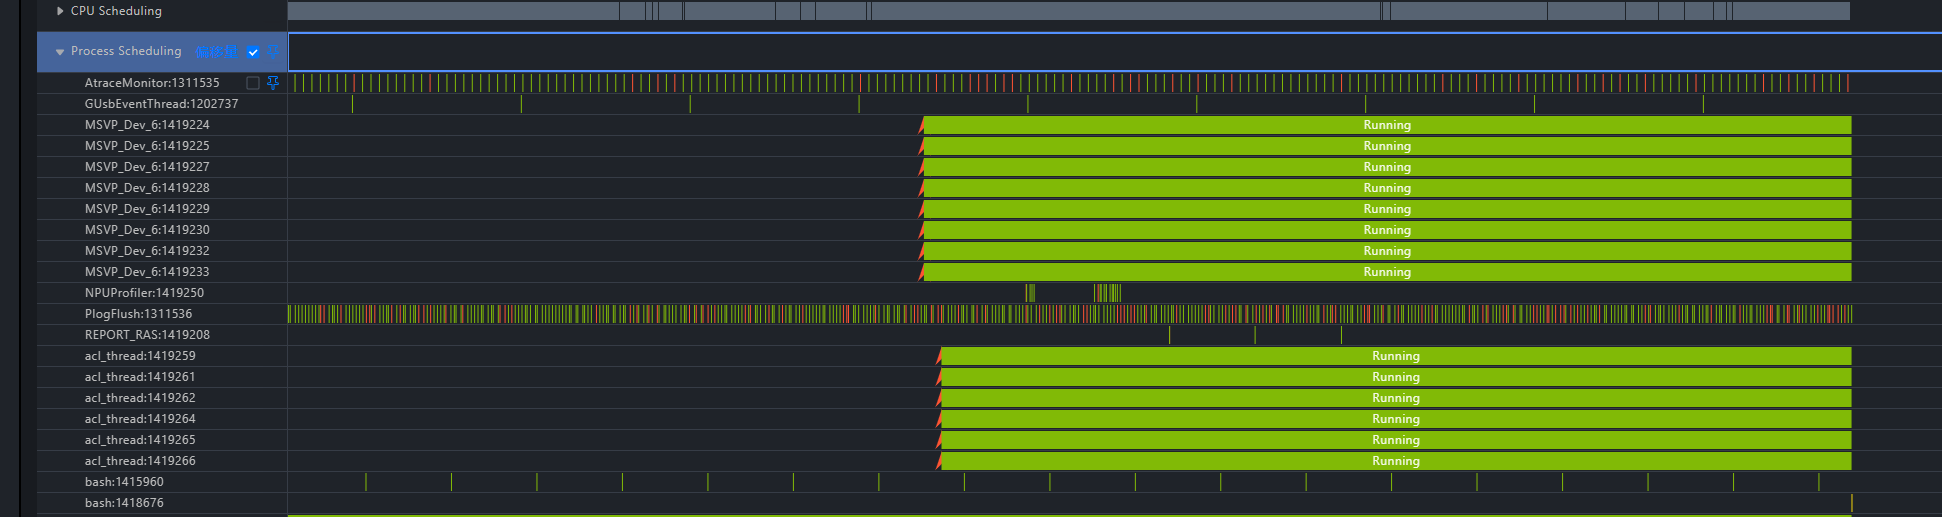
 4. 查看特定进程的调度状态
通过上述流水图,可以观察到进程的调度行为,例如观察进程python3:1418857,可以看到它发生了一次核间迁移,运行过程中存在软中断的情况。
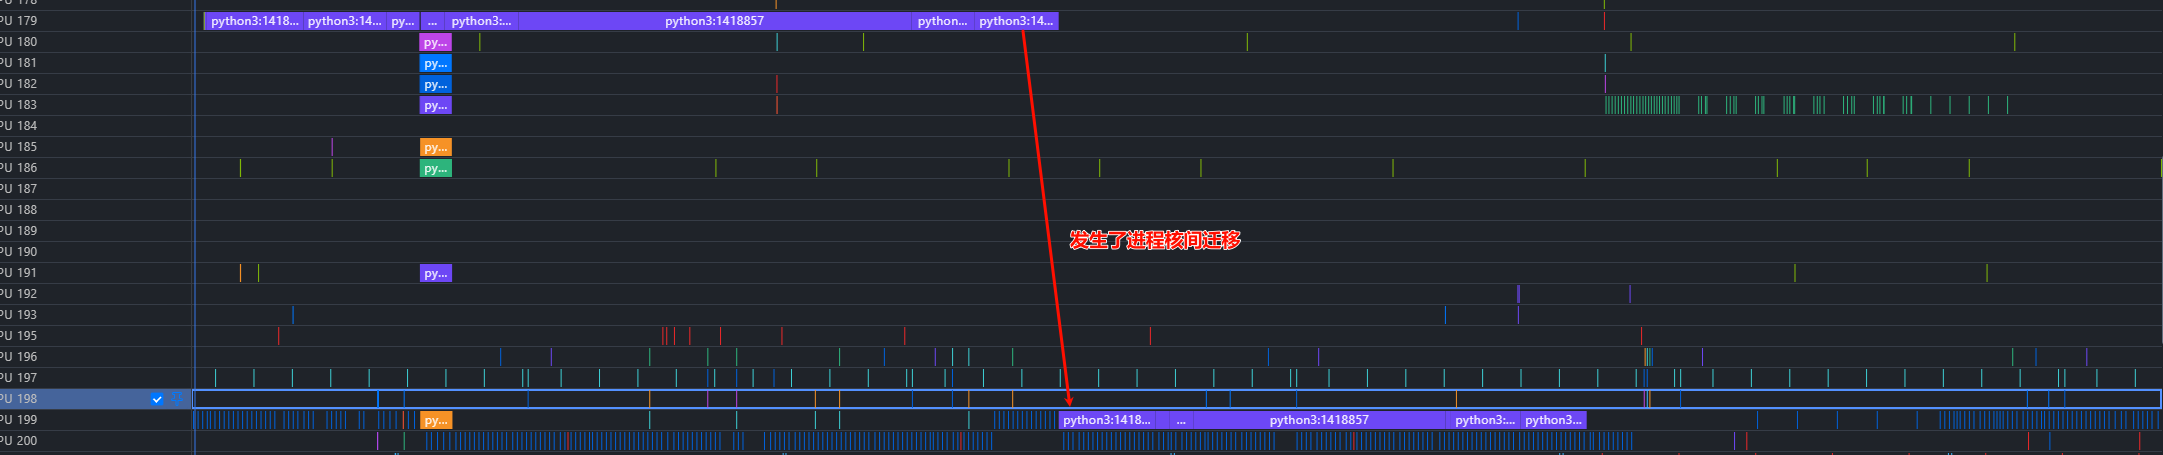


利用Insight的泳道置顶功能,可以更直观的对照调度情况: